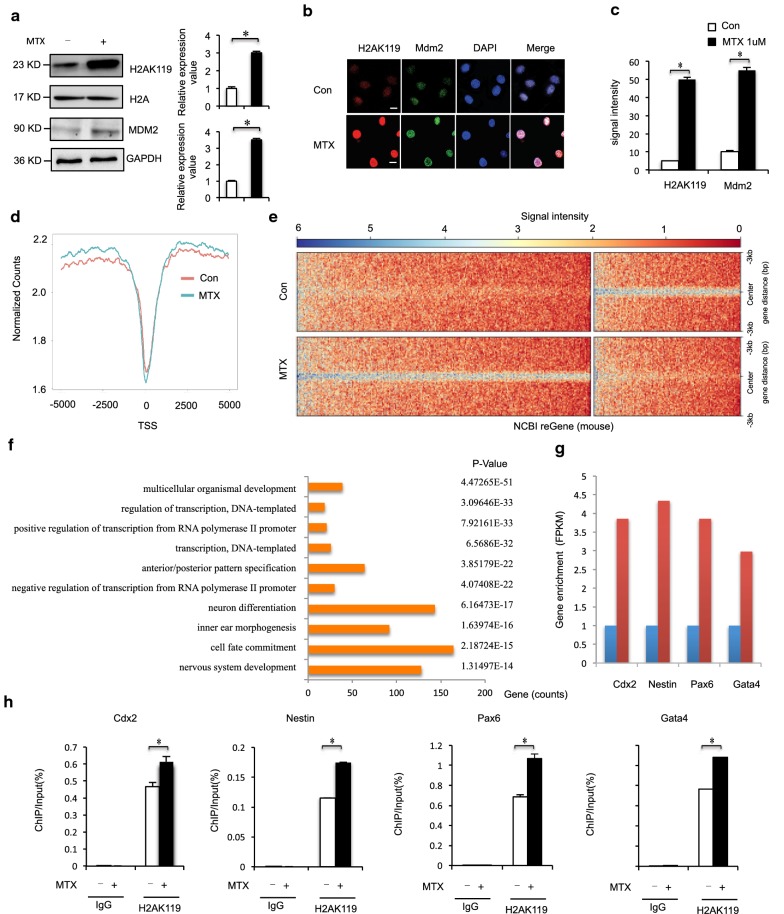
Fig. 2.
a Mouse ESCs were harvested under MTX (1 μM) treatment for 12 h, and analyzed by western blot. Numbers at the bottom were generated by quantification (ImageJ) of the H2AK119ub1 signal normalized to the H3 signal and MDM2 signal normalized to the GAPDH signal. b, c Immunostaining using MDM2 antibodies formed discrete foci in mESC cells for 12 h after exposure to MTX (1 μM) and colocalized with H2AK119ub1. The analysis was confined to the transfected cells. The error bars represent the SEM. d, e H2AK119ub1 ChIP-Seq, aggregated around TSSs. H2AK119ub1 ChIP-Seq in mESC cells 12 h after exposure to MTX (1 μM). f Functional network of enriched genes with H2AK119ub1 peaks. DAVID method was used to do functional annotation clustering for biological process annotations of genes with H2AK119ub1 peaks. g ChIP-seq (upper) analysis on Cdx2, Nestin, Pax6 and Gata4 genes in control and MTX-treated mESC. h ChIP assays of H2AK119ub1 were performed using mouse ESCs treated with 1 μM MTX for 12 h. Mouse IgG was used as control. Enrichment of NTC-related genes Cdx2, Nestin, Pax6 and Gata4 promoters was measured by qPCR. Data are shown as mean (n = 3). *P < 0.05, by Student’s t test

