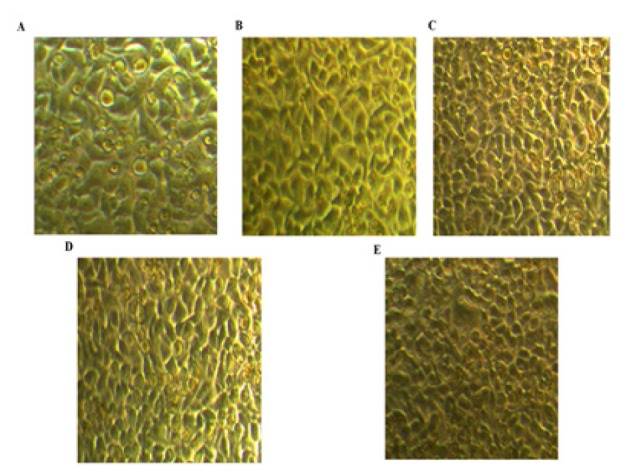
Figure 2.

Effect of IL-6, 1,25D, and VDR on E-cadherin Gene Expression in HCC1806 Cells, Three and Six Days Post-treatment. Quantitative Real-time PCR was used to measure E-cadherin gene expression and the data were normalized to GAPDH gene expression. Experiments were performed in triplicate and the data are presented as the mean ± SD. post-hocTukey's multiple comparison test was applied (a significance vs control group, b significance vs IL-6 group, c significance vs 1,25D group, d significance vs VDR OE.+ 1,25D group,* p ≤ 0.05)
