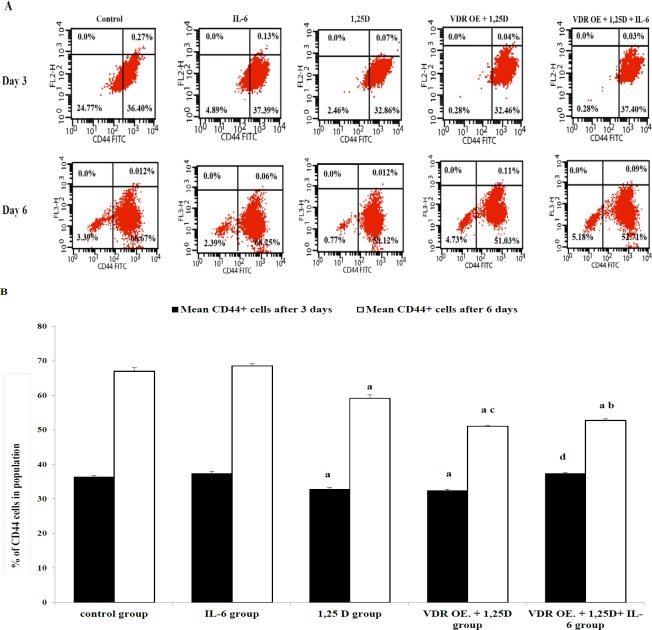
Figure 3.
Effect of IL-6, 1,25D, and VDR on CD44+ Cells in HCC1806 Cells, Three and Six Days Post-Treatment. A . Representative histogram from flow cytometry in control and treated cells after 3 and 6 days are shown. B. The average percentage of CD44+ cells from triplicate measurements are represented as bar graphs to show the difference between control and treated groups. The data are presented as the mean ± SD. post-hoc Tukey's multiple comparison test was applied (a significance vs control group, b significance vs IL-6 group, c significance vs 1,25D group, d significance vs VDR OE.+ 1,25D group,* p ≤ 0.05)

