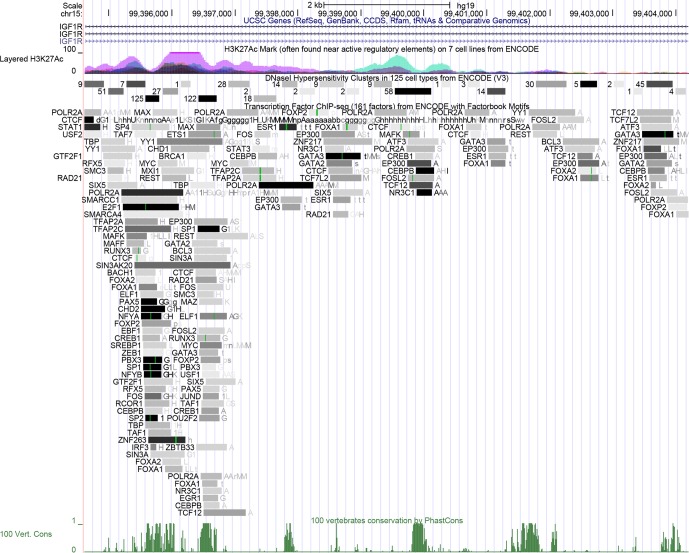
Figure 4.
Bioinformatics analysis of IGF1R CNV. The peak means histone acetylation above this figure. The rectangle with a number or a letter means DNase I hypersensitive sites or sequence-specific TFs, respectively, and the darker the color, the more likely the combination is. The other peak means similarity between the sequence of IGF1R CNV in cattle and the whole-genome sequence in humans at the bottom of this figure.

