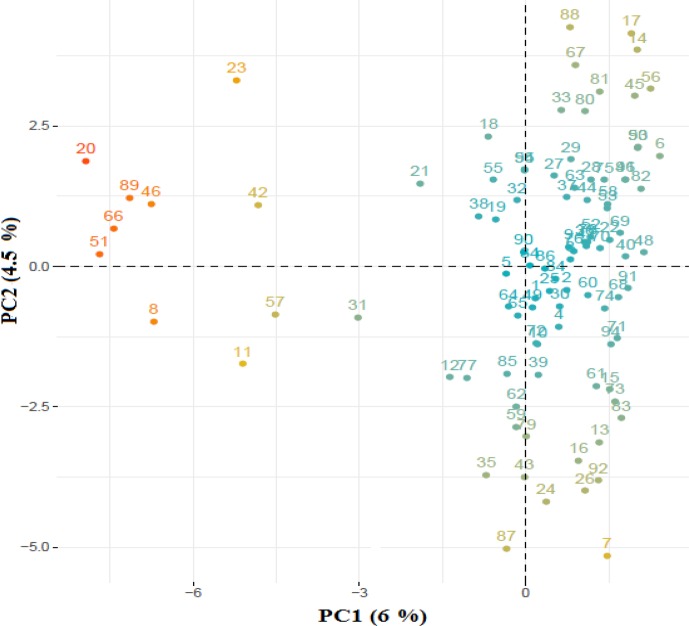
Figure 1.
PCA plot based on a genomic relationship matrix. The first two principal components (PCs) and the variance explained by each component is shown on the corresponding axis. The amount of variance explained by the first two components is relatively small (10.5 %), representing a great deal of genetic diversity among samples.

