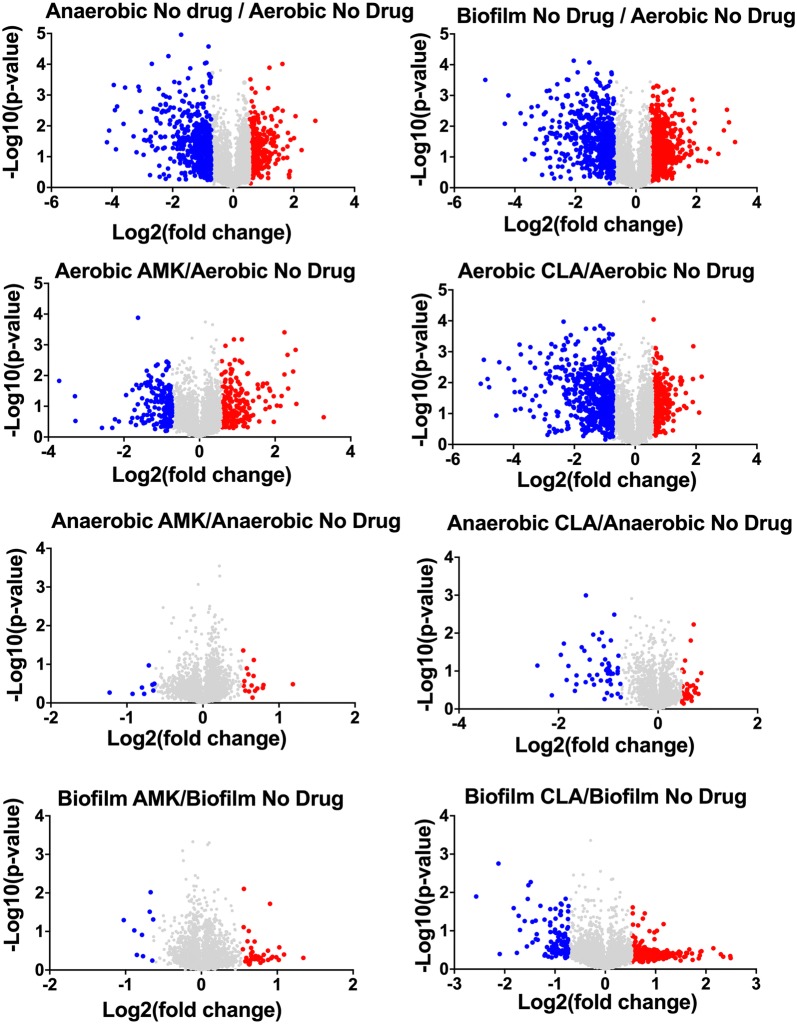
Fig. 2.
Volcano plots showing proteins that are induced or repressed. Proteins with upregulation ≥ 1.5 fold in red and with downregulation ≤ 1.5 in blue; each dot is one protein. The volcano plot shows the log2-fold changes in gene expression induced by anaerobic and biofilm conditions as compared with aerobic control. The volcano plot also shows the log2-fold changes in gene expression induced by AMK and CLA after 24-h exposure to aerobic, anaerobic and biofilm phenotypes. Each condition is compared with the corresponding condition with no drug control

