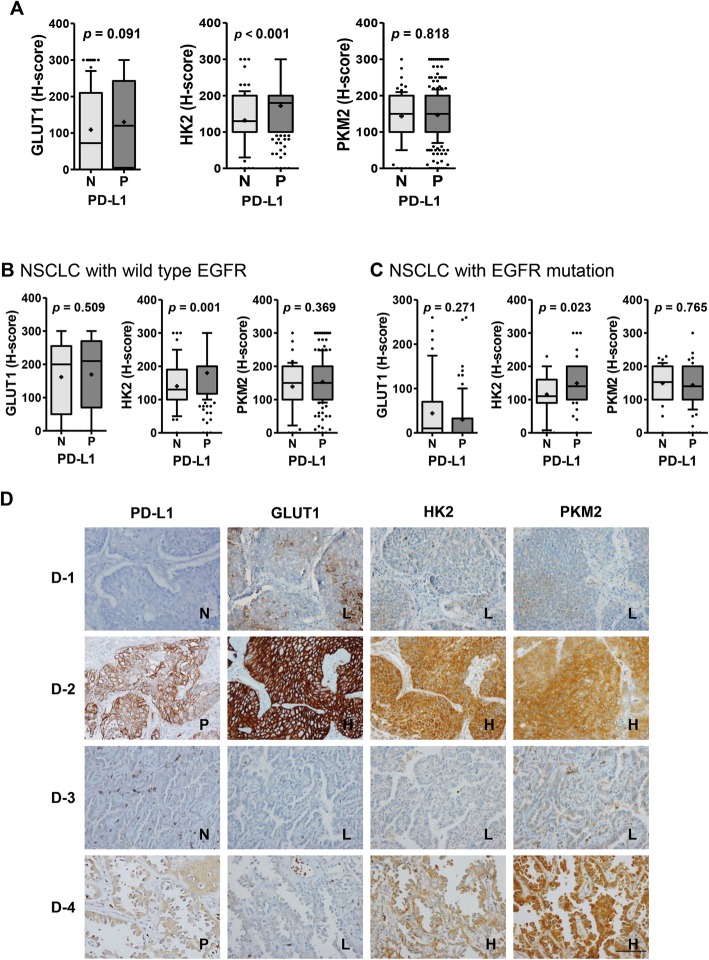
Fig. 4.
Positive correlation between the expression of PD-L1 and HK2 in human lung cancer tissues. Immunohistochemistry (IHC) analyses for GLUT1, HK2, and PKM2 were performed using tumor tissues from NSCLC patients (N = 393). a The expression (H-score) of these molecules was compared between PD-L1negative and PD-L1positive NSCLCs and statistical differences were analyzed using Mann Whitney U-tests. The expression of these molecules was also compared between PD-L1negative and PD-L1positive cases in patients with b wild-type EGFR (N = 230) and c mutated EGFR (N = 126). Statistically differences were analyzed using Mann Whitney U-tests. The whiskers are drawn from the 10th percentile to the 90th percentile. The midline of the box is the median and “+” denotes the mean. Points below and above the whiskers are individual points. d Representative IHC images are as follows: D-1, a pSqCC case that is PD-L1negative and expresses low levels of GLUT1, HK2, and PKM2; D-2, a pSqCC case that is PD-L1positive and expresses high levels of GLUT1, HK2, and PKM2; D-3, a pADC case that is PD-L1negative and expresses low levels of GLUT1, HK2, and PKM2; D-4, a pADC case that is PD-L1positive and expresses low level of GLUT1 and high levels of HK2 and PKM2. Cases were separated into low and high expression group using the median H-score of each molecule as a cutoff. Cases with PD-L1 score 2 and 3 (moderate to strong membranous staining in ≥10% of tumor cells) was designated as PD-L1positive. (original magnification × 400, bar = 100 μm). Abbreviations: N, negative; P, positive; L, low; H, high

