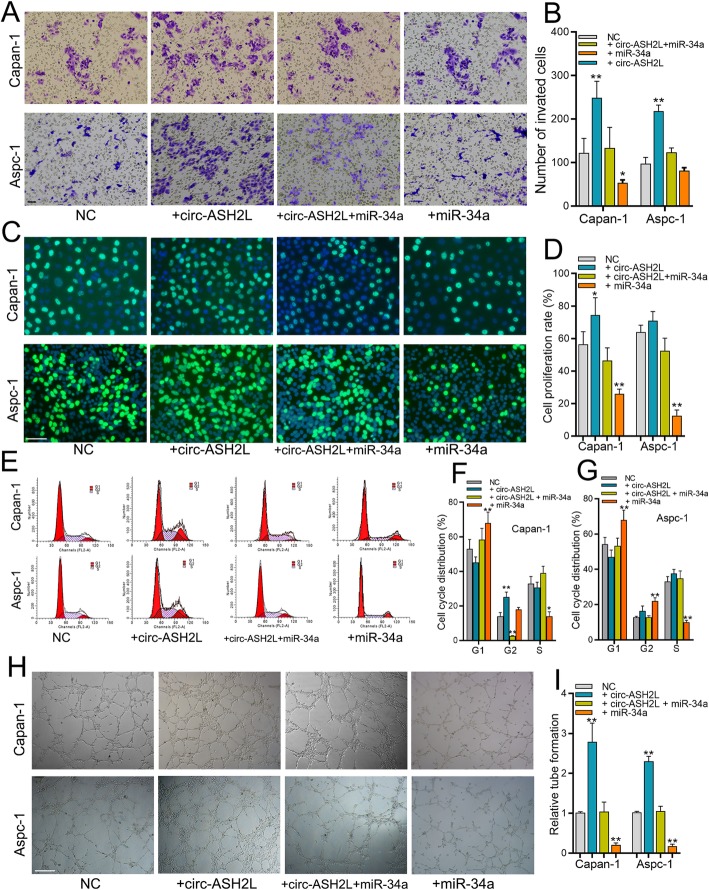
Fig. 4.
a-b The invasion abilities of indicate treated Capan-1 (a) and Aspc-1 cells (b) were measured by transwell assays. Scale bars = 50 μm. c-d The proliferation abilities of indicate treated Capan-1 (c) and Aspc-1 cells (d) were measured by EdU assays. Scale bars = 50 μm. e-g The indicate treated Aspc-1 and Capan-1 cells (e) were stained by propidium iodide and analyzed using flow cytometry, the statistical results of Aspc-1 (f) and Capan-1 (g) cells were showed in right column. h-i The in vitro angiogenesis abilities of indicated treated Capan-1 and Aspc-1 cells were measured by tube-formation assays of HUVECS cells (h), and the statistical result was showed in right column (i)

