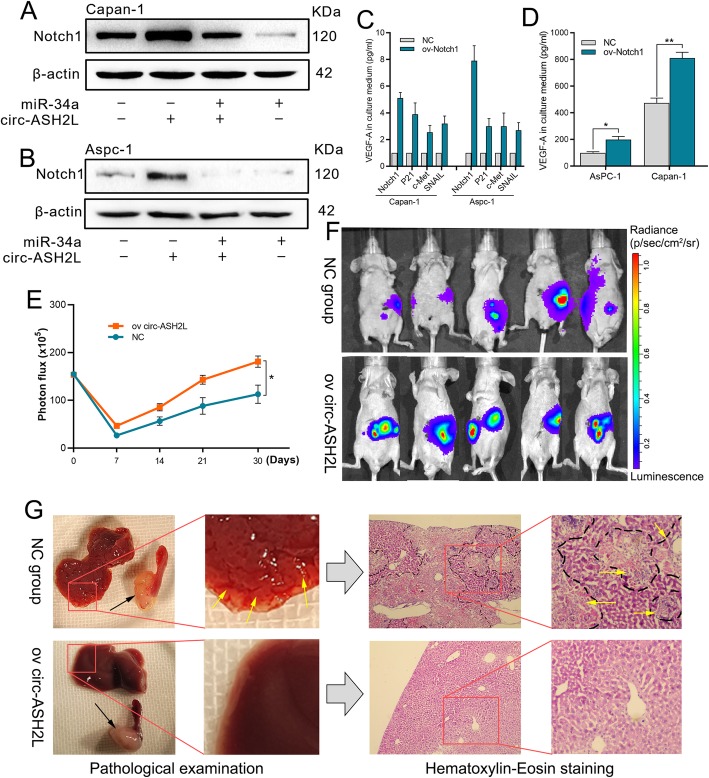
Fig. 5.
a-b The protein expression levels of indicate treated Capan-1 (a) and Aspc-1 (b) cells were measured by WB analysis. c The mRNA expression levels of indicate treated Capan-1and Aspc-1 cells were measured by qRT-PCR analysis. d The protein expression levels of indicate treated Capan-1 and Aspc-1 cells were measured by ELISA analysis. e-g Animal experiments, the luciferase intensities were measured each week (e and f) after intrapancreatic injection with NC or circ-ASH2L overexpressing Capan-1 cells, pancreatic tumor in situ (the black arrows point to) and liver metastasis foci (the yellow arrows point to) were showed by autopsy and H&E staining (g)

