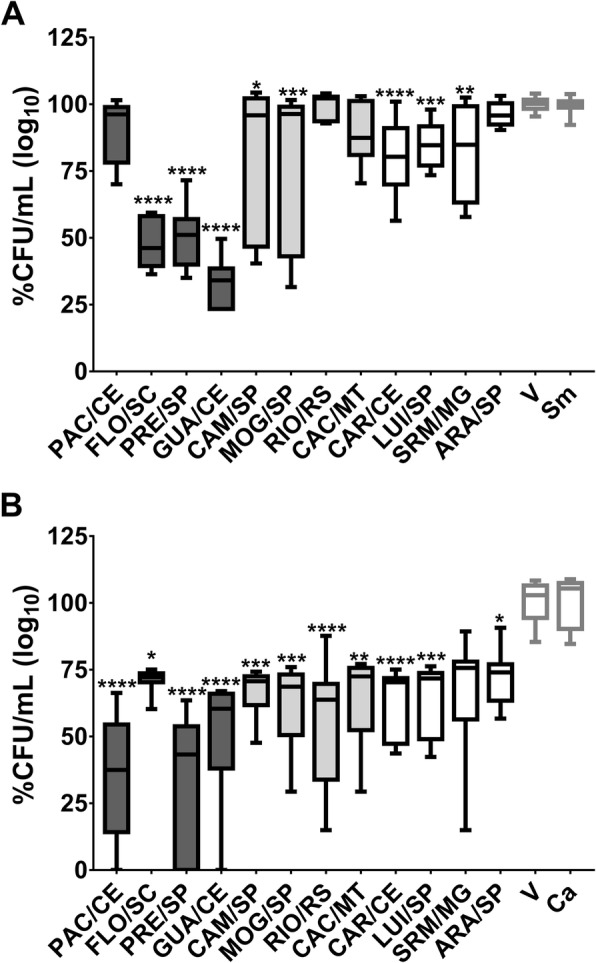
Fig. 2.

Antimicrobial activity of C. sylvestris extracts from Brazilian biomes against S. mutans and C. albicans. a shows S. mutans data while (b) depicts C. albicans data. The data are median (traces) and interquartis (boxes) for the 12 extracts evaluated. The error bars represent the maximum and minimum values. Asterisks denote statistically significant difference of a specific extract versus vehicle (V) control, where: ****p ≤ 0.0001; ***p ≤ 0.001; ** ≤ p < 0.01; and *p ≤ 0.05 (Kruskal-Wallis test, followed by Dunn’s multiple comparisons test). Each species growth control (without treatment) is represented as Sm for S. mutans and Ca for C. albicans. The colors of the bars in each graph represent the variety to which the extracts belong, being, in dark gray color: var. sylvestris; light gray: var. intermediate and white: var. lingua
