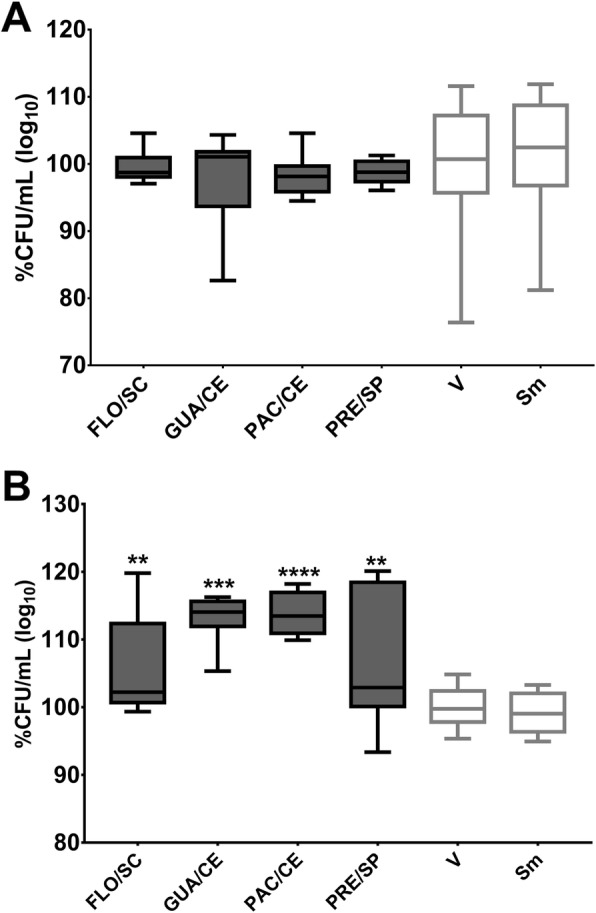
Fig. 6.

S. mutans detachment after adhesion to the treated salivary pellicle and initial matrix of glucans. Post-release data of S. mutans to the treated salivary pellicle and glucans are shown in (a) and (b), respectively. There was no difference between the control vehicle (V), and the extracts tested for both analyses. The percentage of CFU/mL was obtained considering the vehicle control (V) as 100%. The data described are median (traces) and interquartis (boxes). The error bars represent the maximum and minimum values. The asterisks denote a statistically significant difference of a specific extract versus vehicle control (V), where ****p = 0.0001 and **p < 0.0031 (Kruskal-Wallis test, followed by the multiple comparison test of Dunn). The growth control is represented by Sm for S. mutans. The colors of the bars of the graph represent the variety to which the extracts belong, being the color dark gray to var. sylvestris
