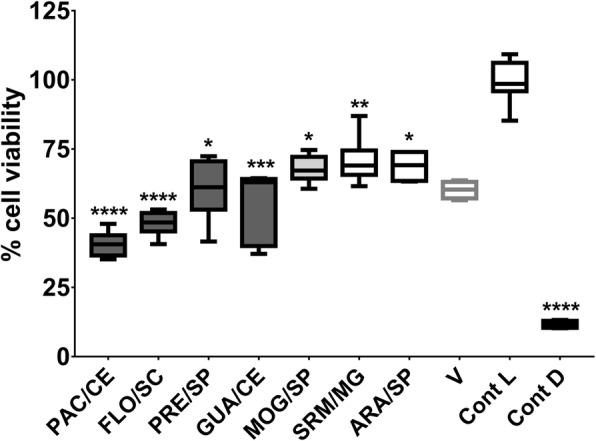
Fig. 7.

Cell viability of keratinocytes NOK-si after exposure to selected extracts. The data described are the medians and the interquartile ranges. The data described are median (traces) and interquartis (boxes). The error bars represent the maximum and minimum values. “Cont L” indicates cell viability control and “Cont D”, the cell death control. The percentage of cell viability was obtained considering the cell viability control as 100%. The asterisks denote a statistically significant difference of a specific extract versus cell viability control control (Cont L), where ****p < 0.0001, ***p = 0.0004, **p = 0.0088, and *p ≤ 0.0204 (Kruskal-Wallis test, followed by the multiple comparison test of Dunn). The colors of the bars of the graph represent the variety of the extracts, being, in dark gray: var. sylvestris; in light gray: var. intermediate; and blank: var. lingua
