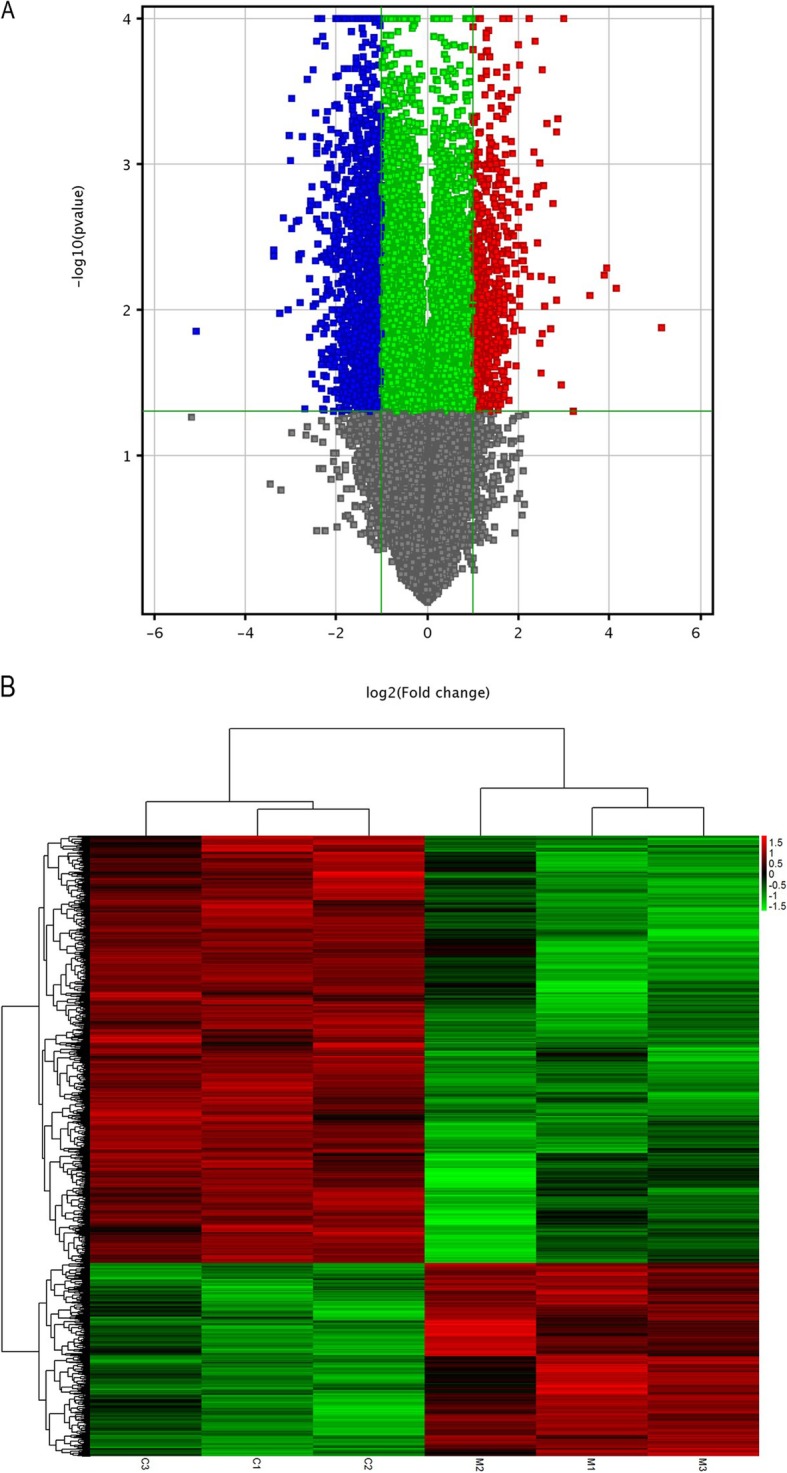
Fig. 1.

Differentially expressed mRNAs in Ishikawa cells treated with MPA compared with untreated cells. a The Volcano plot. Red represents significantly up-regulated mRNAs, blue represents significantly down-regulated mRNAs. b The heat map. Left three column represent control cell samples, right three column represent cells treated with MPA. Each raw represents each mRNA. Red represents significantly up-regulated mRNAs, green represents significantly down-regulated mRNAs
