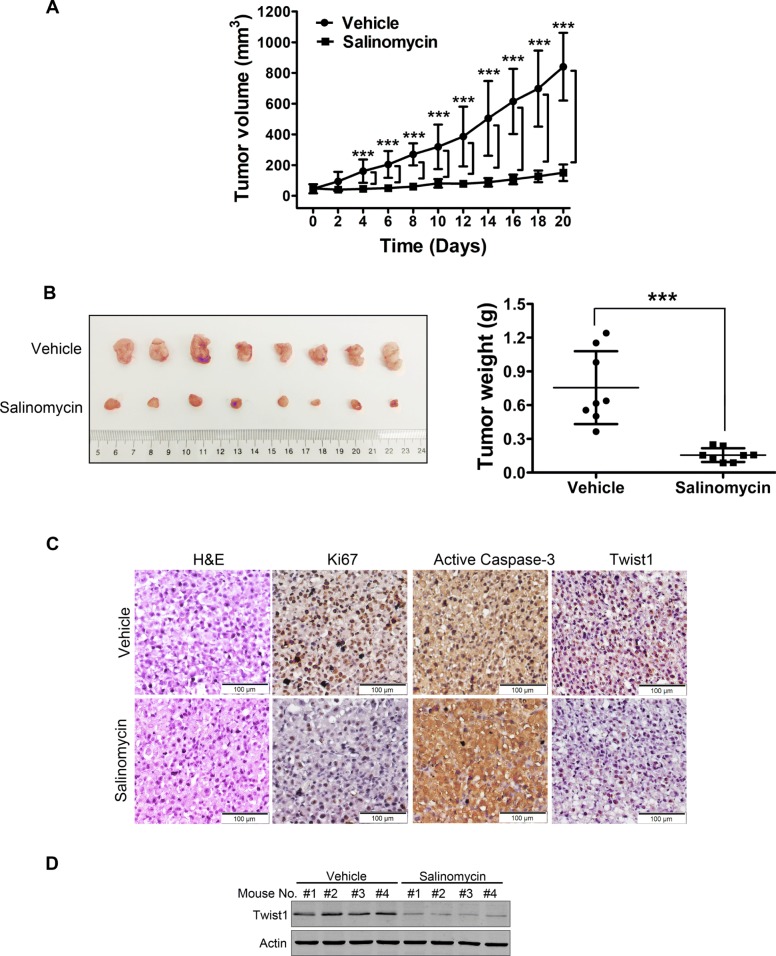
Fig. 4.
Salinomycin suppresses outgrowth of xenografted UM cells in NOD/SCID mice. a Tumor growth curve over time was plotted in the NOD/SCID mice injected (i.p.) with either vehicle (corn oil) or 2.5 mg/kg salinomycin daily. Data represent mean ± SD. ***, P < 0.001. Student’s t test. b Weights of tumors dissected on day 21 after administration with vehicle or salinomycin. Representative tumors are shown (left). Data (right) are the mean ± SD of tumor weights from each group. Vehicle (n = 8), salinomycin (n = 8). ***, P < 0.001. Student’s t test. c Hematoxylin & eosin (H&E) and immunohistochemistry (IHC) staining of Ki67, active caspase-3 and Twist1 in tumor tissue sections were conducted. Scale bar: 100 μm. d Protein levels of Twist1 from the tumors in NOD/SCID mice were analyzed with Western blot

