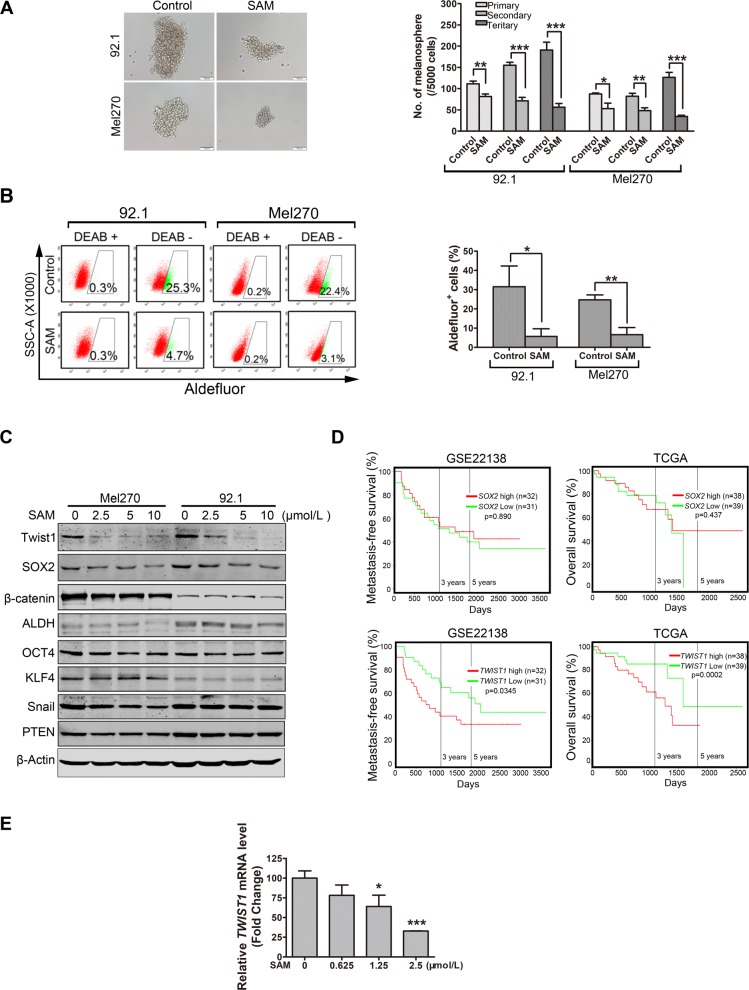
Fig. 6.
Treatment with salinomycin restricts the self-renewal potential and reduces the Aldefluor+ cells in UM cells. a Twenty-four hours after Mel270 and 92.1 cells were treated with SAM (salinomycin) (1.25 μmol/L), 5000 viable cells resuspended in melanosphere culture medium were seeded into the ultralow- attachment 24-well plates. Melanospheres were counted and photographed on day 7. The cells were then harvested and re-plated (5000 cells/well) for the secondary and tertiary rounds of melanosphere culture, respectively. Left: representative images of melanospheres. Scale bar: 100 μm. Right: quantification of melanospheres. Data represent mean ± SD. *, P < 0.05; **, P < 0.01; ***, P < 0.001, one-way ANOVA, post hoc comparisons, Tukey’s test. b Mel270 and 92.1 cells were incubated with 1.25 μmol/L salinomycin for 24 h, Aldefluor+ cells were measured by using a FACS LSRFortessa flow cytometer. Representative flow cytometry dot plots (left) for UM cells and quantitative analysis (right) from three independent experiments are shown. Data represent mean ± SD. ns, not significant; *, P < 0.05; ***, P < 0.001, Student’s t test. c 92.1 and Mel270 cells were treated with salinomycin for 24 h, the protein levels of stemness-related proteins in control or salinomycin- treated cells were determined by Western blot. d Kaplan–Meier survival analysis of liver metastasis-free survival and overall survival of patients with UM was done based on the median expression level of mRNA (SOX2 or TWIST1) from GSE22138 dataset and TCGA dataset, respectively. e qRT-PCR analysis of TWIST1 mRNA level after treatment with salinomycin in 92.1 cells. *, P < 0.05; ***, P < 0.001, one-way ANOVA, post hoc comparisons, Tukey’s test

