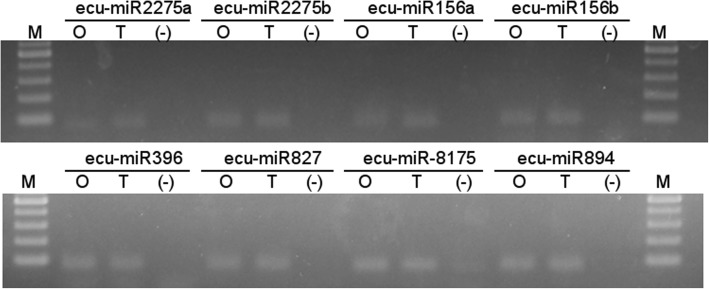
Fig. 2.
Specific amplification of conserved miRNAs from E. curvula. For clarity, a single run per genotype is shown. The miRNA assayed is listed above each amplification band. O, cDNA from genotype OTA-2; T, cDNA from genotype Tanganyika; (−), negative control; M, molecular weight markers. The band at the bottom is 100 bp

