
Fig. 1.
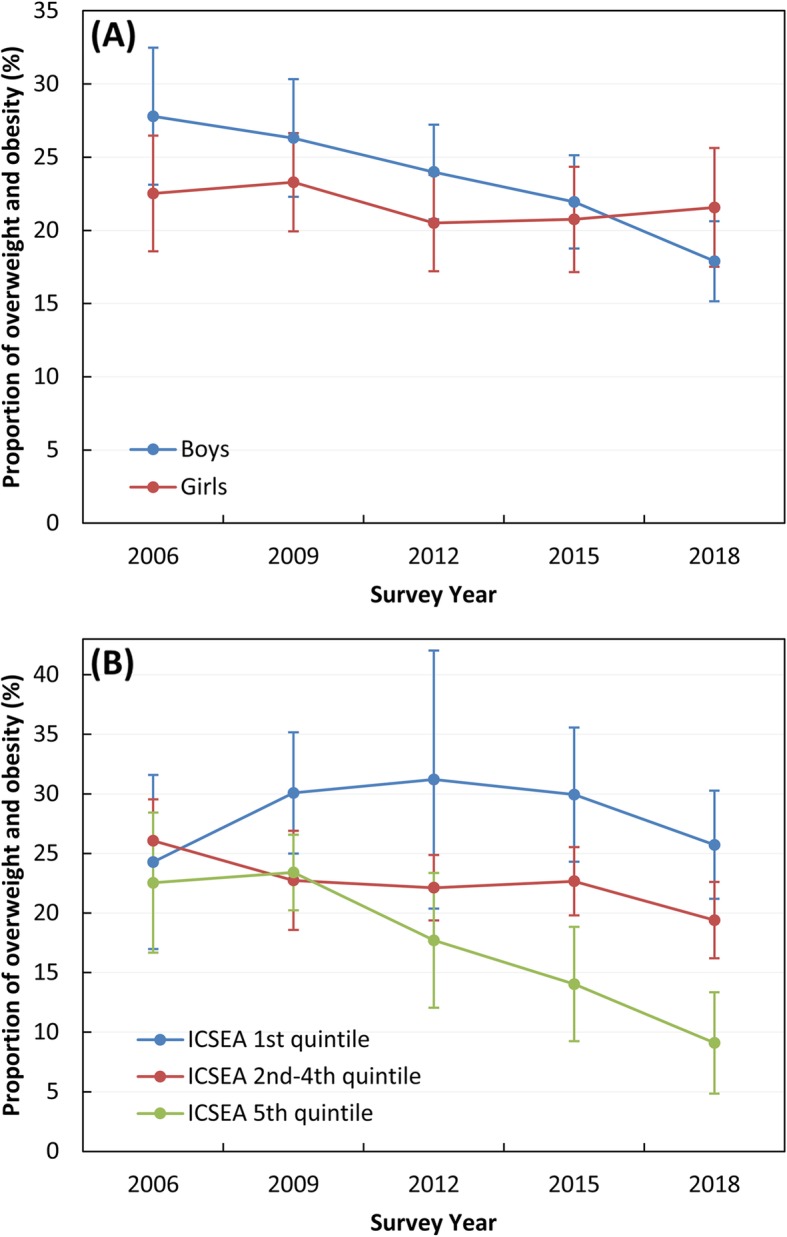
Prevalence of overweight and obesity in ACT Year 6 children, 2006–2018 by sex (a) and by quintiles of Index of Community Socio-Educational Advantage (ICSEA) (b). Error bars indicate 95% confidence intervals for weighted proportions
Official websites use .gov
A
.gov website belongs to an official
government organization in the United States.
Secure .gov websites use HTTPS
A lock (
) or https:// means you've safely
connected to the .gov website. Share sensitive
information only on official, secure websites.
Prevalence of overweight and obesity in ACT Year 6 children, 2006–2018 by sex (a) and by quintiles of Index of Community Socio-Educational Advantage (ICSEA) (b). Error bars indicate 95% confidence intervals for weighted proportions