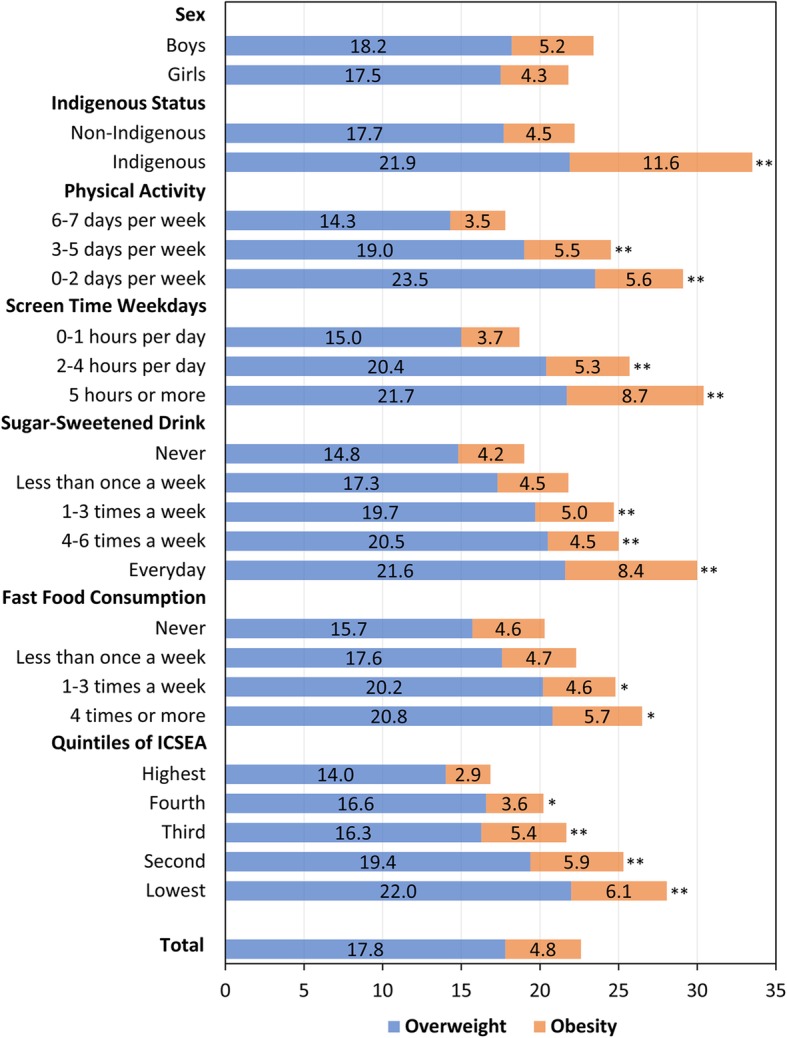
Fig. 3.

Prevalence (%) of overweight and obesity in ACT Year 6 children by selected demographic and behavioural factors, 2006–2018. Statistically significant differences comparing to the reference group (the first category) for the prevalence of overweight and obesity combined were indicated by * (p < 0.05) and ** (p < 0.01). ICSEA: Index of Community Socio-Educational Advantage
