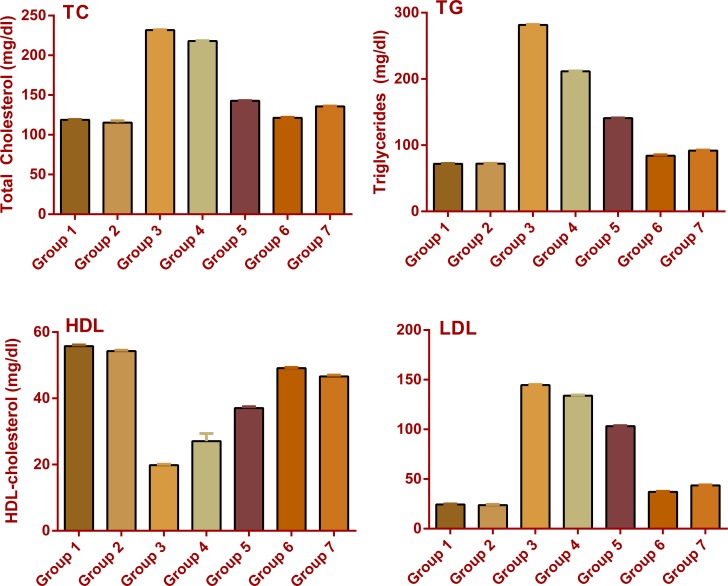
Figure 5.
Effect of HBAO on Lipid Profile at different time interval of therapy: Group 1: Normal control; Group 2: Normal + HBAO (60 mg/kg p.o.); Group 3: Diabetic Control (Infused with STZ 60 mg/kg i.p); Group 4: Diabetic + HBAO (20 mg/kg p.o.) & continue till End; Group5: Diabetic + HBAO (40 mg/kg p.o.) & continue till End; Group6: Diabetic + HBAO (60 mg/kg p.o ) & continue till End; Group 7: Diabetic + Glimepiride (10mg/kg p.o.) & continue till End. END = 45 Days.

