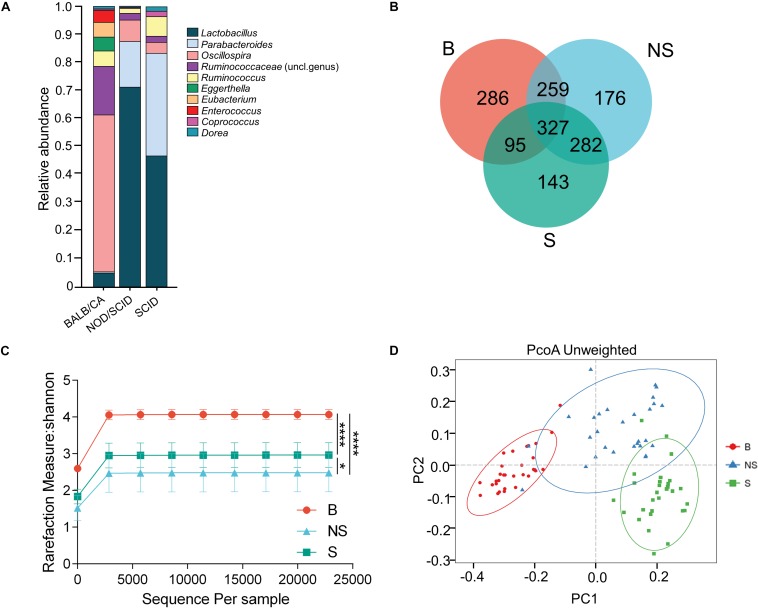
FIGURE 1.
Compositional separation of the microbiota in three different groups. (A) Genus-level microbial classification of bacteria from BALB/cA, NOD/SCID, and SCID mouse stool samples. (B) Venn diagram of OTUs of the fecal microbiota in three groups. (C) Diversity of bacterial species (>97% identity), as indicated by the Shannon rarefaction measure. (D) Unweighted Unifrac metrics separate the BALB/cA mice (red dot), NOD/SCID mice (blue triangle), and SCID mice (green square) microbiota. Each symbol represents a sample. B, BALB/cA mice; NS, NOD/SCID mice; S, SCID mice; ∗p < 0.05, ∗∗∗∗p < 0.0001.

