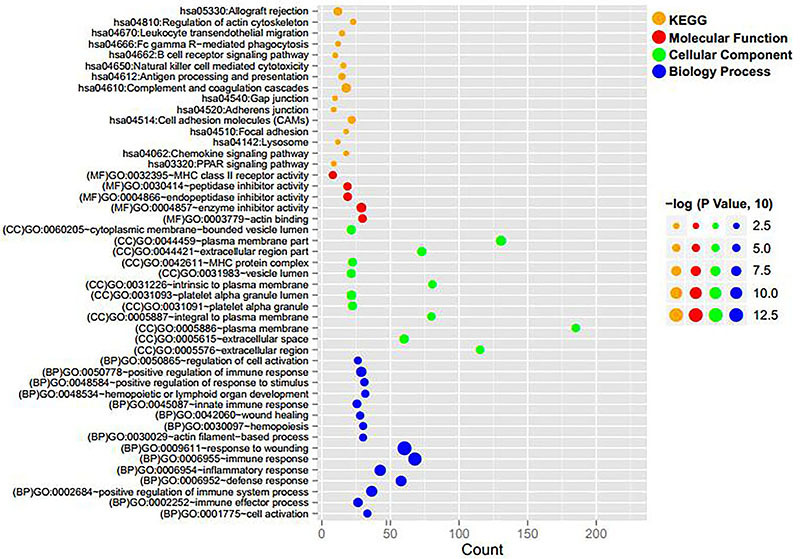
Figure 3. Distribution diagram of enriched Gene Ontology (GO) functions and KEGG pathways of differentially expressed mRNAs and lncRNAs. Orange, red, green, and blue dots indicate KEGG pathway, molecular function, cellular component, and biological process, respectively.

