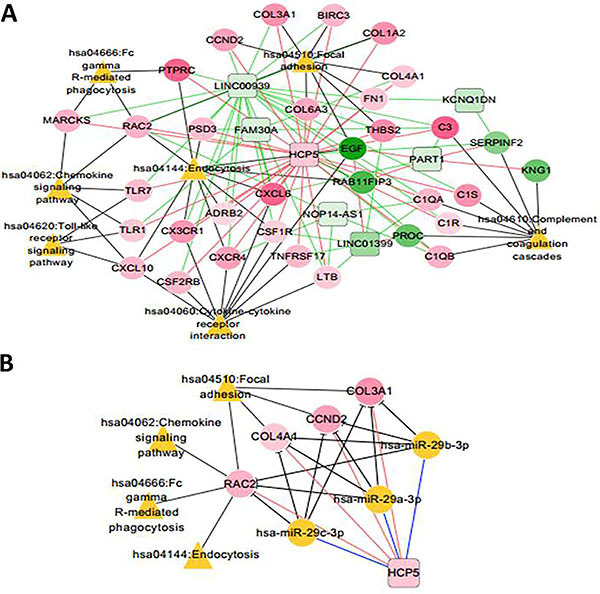
Figure 8. A lncRNA-mRNA-pathway network (A) and a lncRNA-miRNA-mRNA-pathway network (B) related to chronic kidney disease (CKD). Green lines represent negative correlations; pink lines represent positive correlations; black lines represent gene connection with KEGG pathways. Squares indicate lncRNA; circles indicate mRNA; yellow circles indicate miRNA; triangles indicate pathways. The node change from green to pink indicates that log fold change changed from negative to positive.

