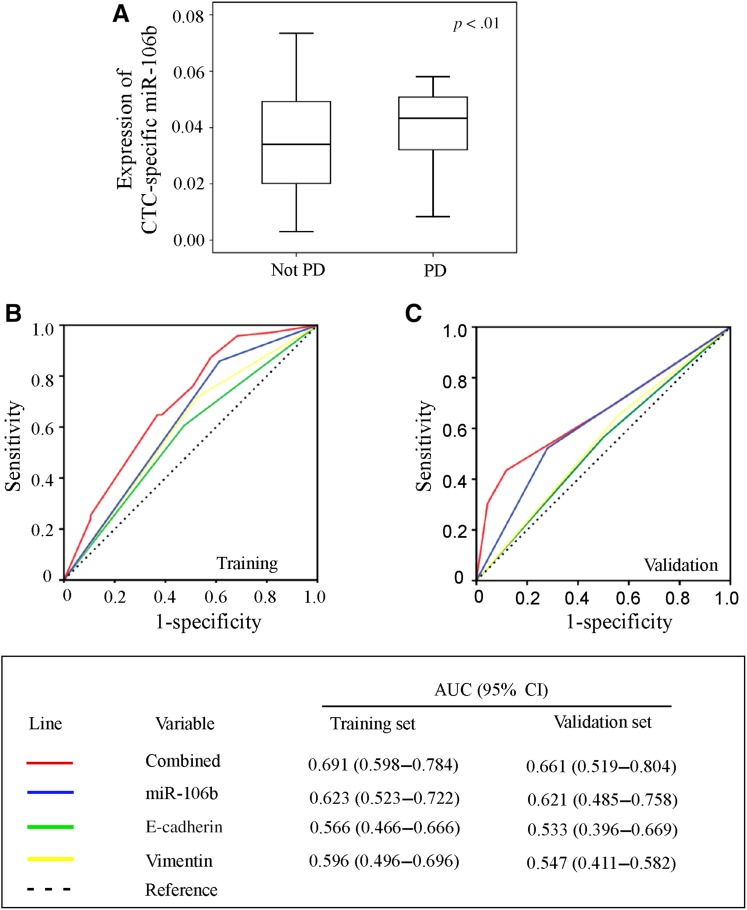
Figure 5.
(A): Correlations between expression of CTC‐specific miR‐106b and clinical response. Comparison of the prognostic accuracy of single and combined factors in the training set (B) and validation set (C).
Abbreviations: AUC, area under the curve; CI, confidence interval; CTC, circulating tumor cell; PD, progressive disease.

