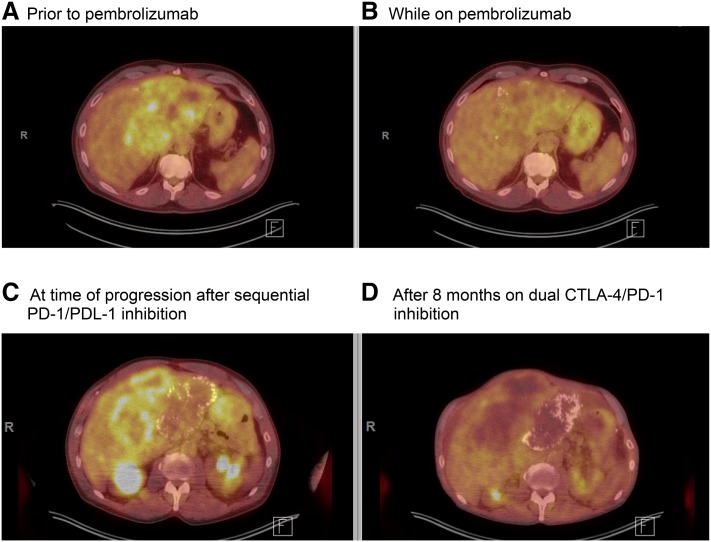
Figure 1.
Positron emission tomography and computed tomography (PET/CT) throughout treatment. (A): PET/CT prior to initiating pembrolizumab. (B): PET/CT after 5 months of immunotherapy indicating a partial response with decrease in standardized uptake value (SUV) of liver mass from 6.5 down to 4.6. (C): PET imaging at time of progression after atezolizumab and pembrolizumab with maximum SUV of 6.5. (D): PET obtained after 8 months on ipilimumab plus nivolumab for four doses followed by nivolumab alone showed a response to combination therapy with a maximum SUV of 3.6.

