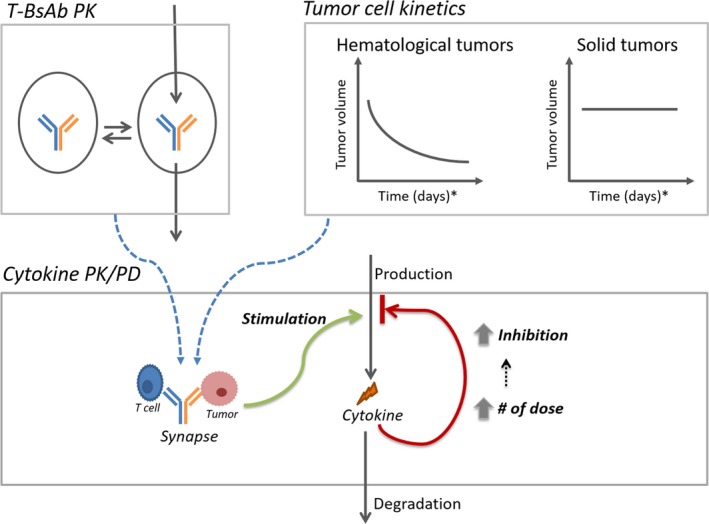
Figure 1.

Cytokine pharmacokinetic/pharmacodynamic (PK/PD) model structure. Model details are described in the methods section. Briefly, an appropriate PK model accounts for the drug exposure. Depending on the tumor type (hematological or solid), the tumor kinetics are accounted for in the model to account for the impact of tumor burden on the active synapse concentration. For the cytokine PD model, the synapse exposure then stimulates cytokine release. A time‐variant negative feedback loop accounts for the priming effect, where the negative inhibition increases with the increasing number of doses. T‐BsAb, T‐cell–engaging bispecific antibody.
