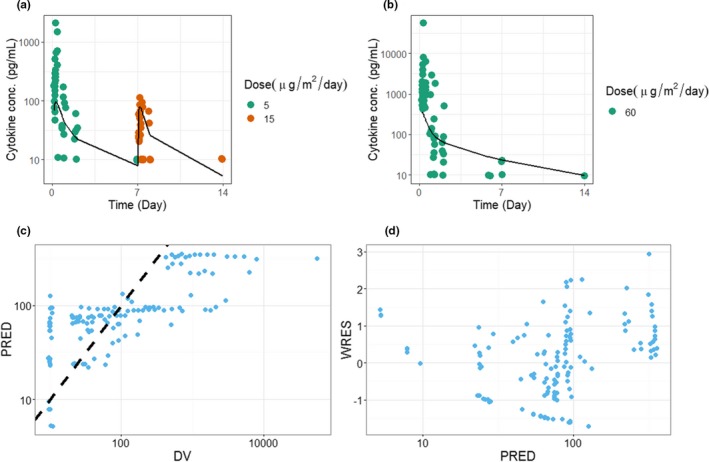
Figure 2.

Fitting results for blinatumomab in patients. (a) Model predictions and observed data for cytokine concentration with a priming dose regimen of 5 μg/m2/day followed by 15 μg/m2/day. Symbols represent individual observations, and lines represent the model fit. (b) Model predictions and observed data for cytokine concentration with a single dose at 60 μg/m2/day. Symbols represent individual observations, and lines represent the model fit. (c) Concordance plot between the data (DV) and the model prediction (PRED). The dotted line is the line of unity. (d) Weighted residual error (WRES) against the PRED.
