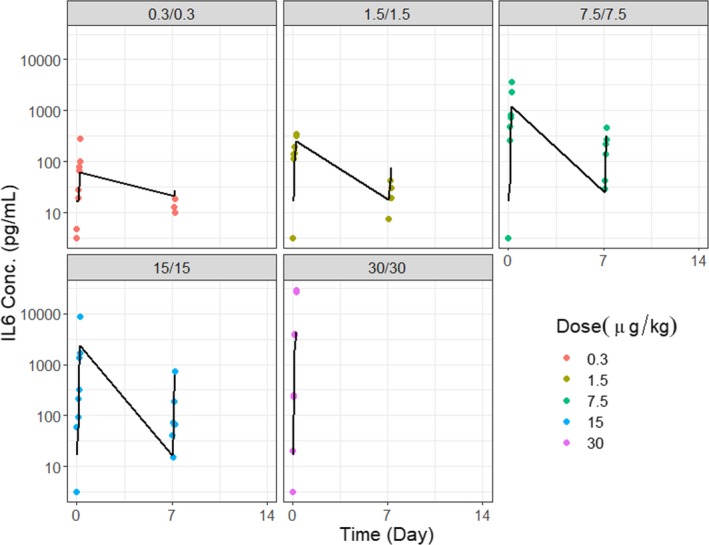
Figure 3.

Fitting results for P‐cadherin LP DART in cynomolgus monkeys under repeated dosing regimens. Model predictions and observed data for IL‐6 concentration with repeated doses at 0.3, 1.5, 7.5, 15, and 30 μg/kg. Symbols (observations); lines (model fit).
