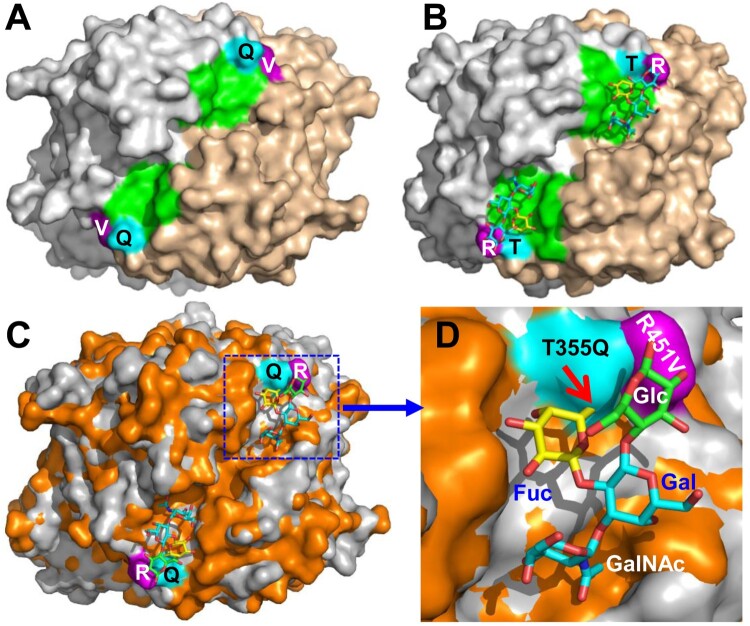
Figure 7.
Structural comparisons of the glycan binding sites between the GII.3 TV24 and the GII.11 VA34. (A and B) Top views of the surface structures VA34 (A) and TV24 (B) P dimers (surface model with two monomers coloured as grey and sand) with the indication of the proved HBGA binding sites (HBSs, green) of TV24 (B) and the corresponding location (green) of VA34 (A). Two major mutations, T/Q355 (cyan) and R/V451 (purple) at this region of VA34 (numbered based on GII.11 VA34, see Figure 4 for details) are shown. (C and D) Superimposition of the top surface structures of the TV24 (grey) and VA34 (orange) P dimers (C) with a closeup of the HBS locations in (D), highlighting the T355Q (cyan) and the R451 V (purple) mutations (numbered based on GII.11 VA34). The type A tetrasaccharides that bind TV24 are shown in a stick model with indication of the four sugars individually. The red arrow indicates the clash between the Q355 and the Fuc.

