Figure 3.

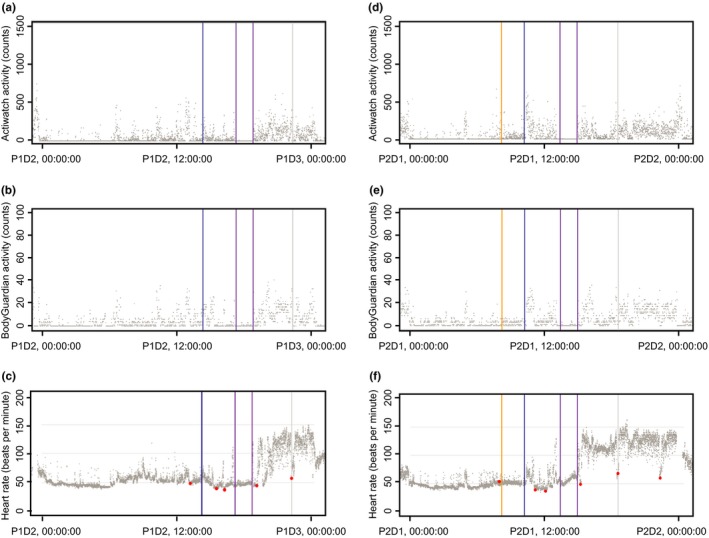
Changes in heart rate (HR) before and after amphetamine challenge in (a–c) period 1 and (d–f) period 2 of the study. Gray dots indicate data produced by wearable devices: activity counts by Actiwatch (a, d), activity counts by the BodyGuardian device (b, e), and HR (c, f). Red dots indicate HR measurements done in clinic by the conventional method. The blue line indicates the timing of amphetamine challenge, the magenta line indicates the start and end of positron emission tomography scans, and the yellow line indicates the time of TAK‐041 dose during period 2. D, day; P, period; P1D2, period 1 day 2.
