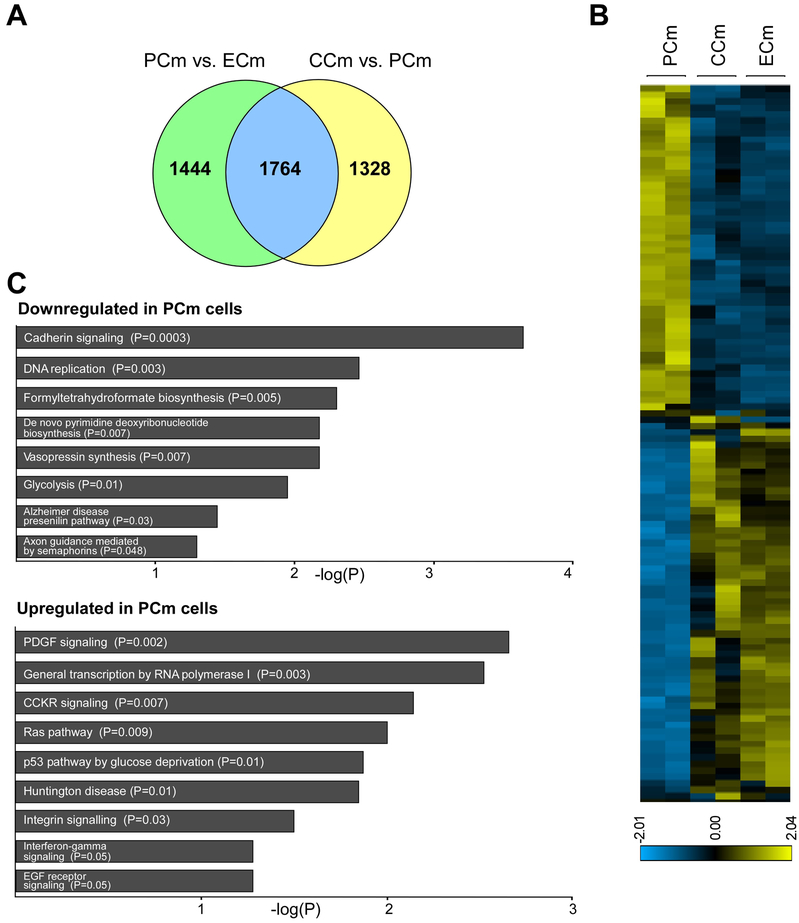
Figure 4. Editing of the expanded GAAs partially corrects FRDA transcriptome.
(A) Venn diagram illustrating the comparison of differentially expressed genes between PCm and ECm cells (p<0.01) with genes differentially expressed between CCm and PCm cells (p<0.01). (B) A heatmap illustrating expression of the 1764 genes differentially expressed in both groups (PCm/ECm and PCm/CCm; Supplemental Table 3). (C) PANTHER pathways analysis of genes downregulated and upregulated in PCm versus CCm cells (p<0.05).

