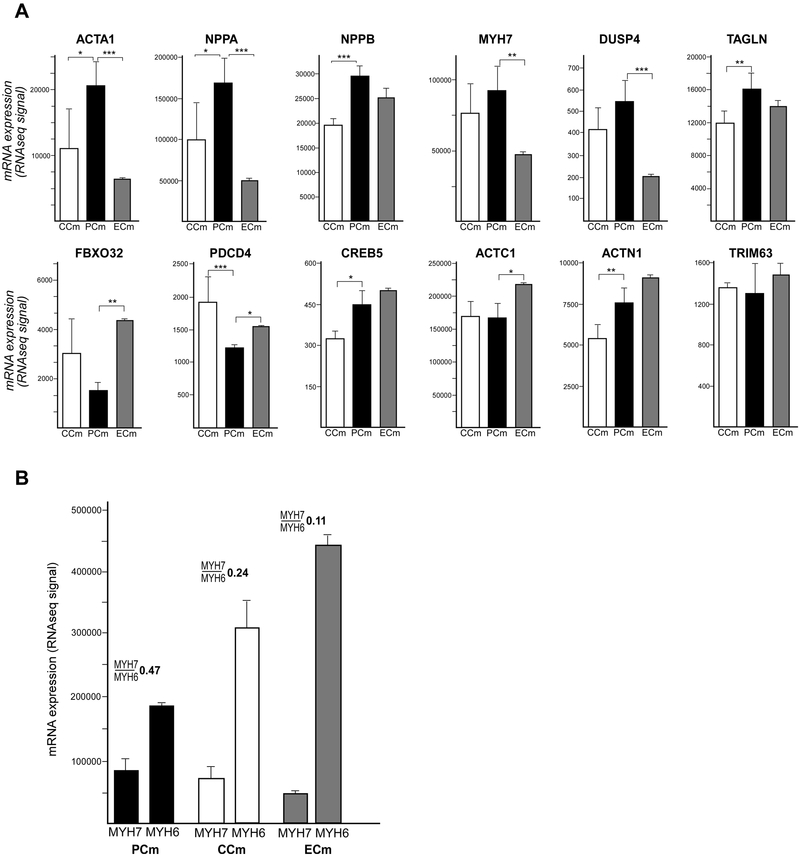
Figure 7. Expression signature of cardiac hypertrophy in PCm cells.
(A) Expression values of a 12-gene cardiac hypertrophy signature (Carlson et al., 2013) are presented as mean with a signal range. Significant differences are indicated by asterisks: * p≤0.05, ** p≤0.01 and *** p≤0.001. (B) Changes in MYH7 and MYH6 expression for PCms compared to CCm and ECm cells along with the calculated MYH7/MYH6 expression ratio are shown by the bar graph.

