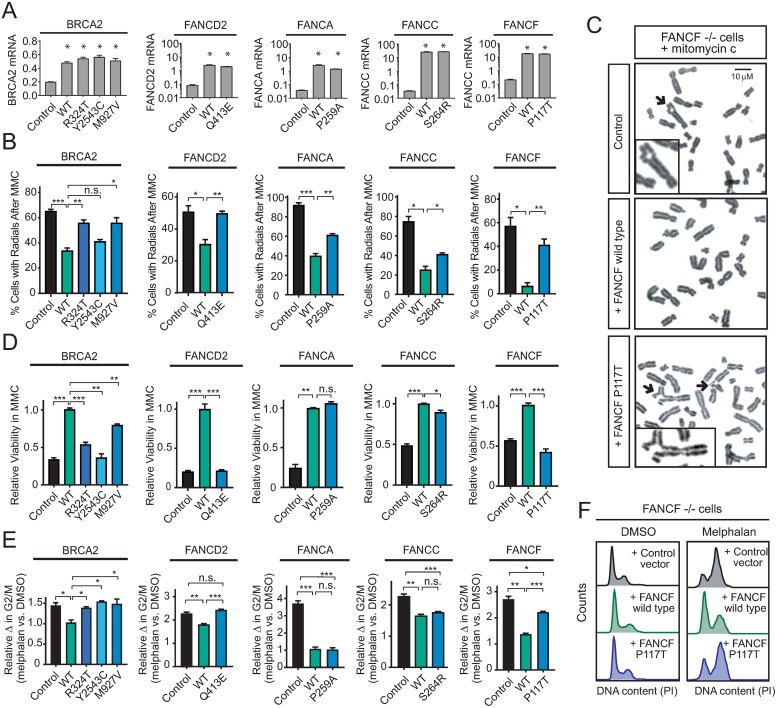
Fig 2. Fanconi-BRCA mutations in T-ALL encode pathogenic alleles.
A panel of cell lines deficient for BRCA2 (VU423), FANCD2 (PD20), FANCA (GM6914), FANCC (PD331) or FANCF (EUFA121.L) were transfected with pcDNA3 (BRCA2) or retrovirally infected with PMMP expression constructs encoding the wild-type (WT) gene (FANCD2, FANCA, FANCC, FANCF), control vector, or each of the indicated point mutant alleles identified in T-ALL patient samples. (A) Relative mRNA expression of the transduced genes was assessed by Q-RT-PCR analysis. All units are % of β-actin control. (B) The indicated cells were treated with mitomycin C (MMC; 20 ng/mL) for 48 hours, and radial chromosome formation was assessed by metaphase spread analysis. Radial chromosome formation was assessed in a minimum of 25 metaphases from each of three independent biologic replicates for each condition, and are plotted as mean +/- s.e.m. (C) Representative metaphase spread from the experiment shown in (B), with black arrows denoting radial chromosomes. (D) Relative viability was assessed by CellTiterGlo in the indicated cells transduced with the indicated constructs, following treatment with mitomycin C (MMC) at the following dosing: BRCA2 cells, 500 nM; FANCD2 cells, 100 nM; FANCA cells, 100 nM; FANCC cells, 500 nM; FANCF cells, 50 nM. (E) Cell cycle analysis was performed by PI staining in each of the transduced cell lines following treatment with melphalan at 0.25 μg/ml (BRCA2, FANCD2, FANCA, FANCC) or 0.5 μg/ml (FANCF) for 48 hours. The change in the percentage of cells in G2/M is shown relative to that in DMSO vehicle-treated cells. (F) Representative histograms of DNA content (PI) for each of the FANCF transduced cells in (E) are shown. All bar charts represent the mean +/- s.e.m. of three independent biologic replicates, with significance assessed by Welch t-test with Bonferroni adjustment for multiple comparisons as appropriate. ***, P ≤ 0.001; **, P ≤ 0.01; *, P ≤ 0.05; n.s., P > 0.05.

