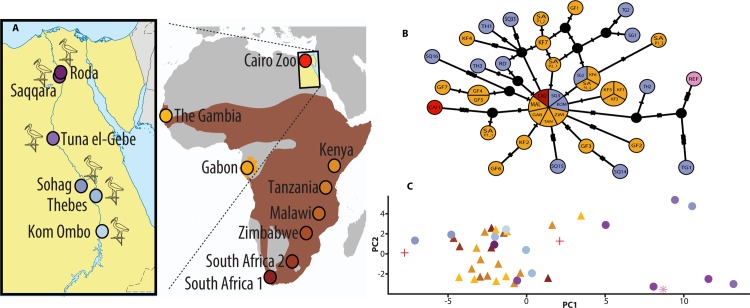
Fig 2.
A Location of ancient catacombs sampled. Modern populations sampled; brown shading indicates the current distribution of Sacred Ibis. We thank Vivian Ward for drawing this figure. B Median-joining network derived from modern (orange shades) and ancient (purple shades) mitochondrial genome sequences. Circle size indicates number of samples. REF represents the Sacred Ibis mitochondrial reference genome shown in pink. Samples taken from captive Ibis at the Cairo Zoo are shown in red. C Principal Coordinates Analysis of distances between aligned mitogenomes of ancient (triangles) and modern (circles) Ibis. The ordination captures a very high proportion of variance in genetic distances (78.4%), with axis 1(horizontal) representing 63.2% and 15.2% for axis 2 (vertical). The asterisk denotes the reference sequence and the crosses denote Cairo Zoo. Colours in B and C correspond to the locations in A.

