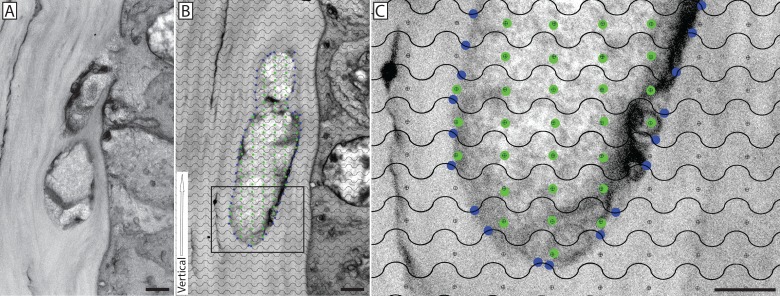
Fig 1. Morphometric analysis of corneal nerve surface-to-volume ratio using a cycloid grid.
A single image from an SBF-SEM series showing a nerve that has fused with a basal epithelial cell (A). A micrograph from this series was selected at random and a cycloid grid was randomly cast onto the image while maintaining the orientation of the grid (defined by the vertical white arrow) parallel to the epithelial basal lamina (B). The intersection of the grid lines with the surface of the nerve bundle are marked with blue dots (surface area) while grid points falling within the nerve bundle are marked with green dots (volume); the inset, enlarged in panel (C), offers a magnified view of the grid. Scale bars = 2 μm.

