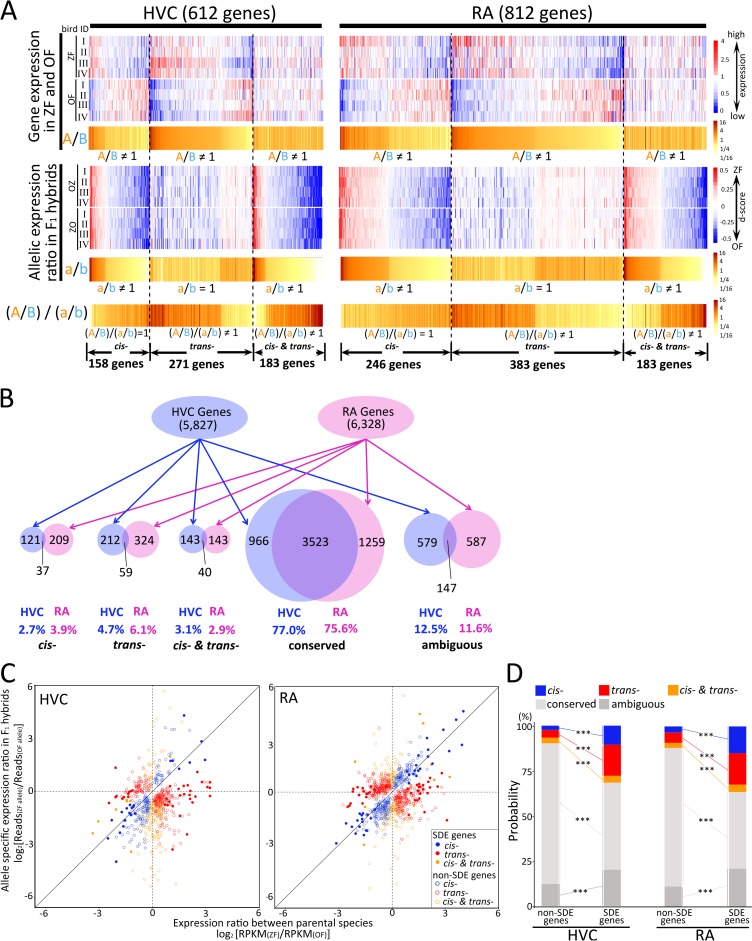
Fig 4. Classification of transcriptional regulation divergence between ZF and OF.
(A) Heatmaps of gene expression in ZFs and OFs, and allelic expression ratios in F1 hybrids for cis-, trans-, and both cis- and trans-regulated genes in song nuclei HVC and RA (blue–red colored). Comparison between species-different gene expression (A/B) and allelic expression ratios in F1 hybrids (a/b) in heatmaps (dark brown–light yellow colored). “A” and “B” represent RPKM(ZF average) and RPKM(OF average), respectively. “a” and “b” represent Reads (ZF allele) and Reads (OF allele), respectively. (B) Gene numbers classified by cis-, trans-, both cis- and trans-, conserved, and ambiguous regulation in HVC and RA. (C) Scatterplots of expression ratios between ZF and OF (x-axis) and allelic expression ratios in F1 hybrids (y-axis) for genes showing differential expression between species. Blue-, red-, and orange-colored spots: cis-, trans-, both cis- and trans-regulated genes, respectively. Filled spots correspond to species-differentially expressed (SDE) genes. (D) Cis- and trans-effects on the expression of species-differentially regulated genes. The percent of cis-, trans-, both cis- and trans-, conserved, and ambiguous transcriptional regulatory genes in the SDE and non-SDE genes (Fisher’s exact test, ***p < 0.001). Relevant data values are included in S3 Data. F1, first-generation; OF, owl finch; RA, robust nucleus of the arcopallium; RPKM, reads per kilobase of transcript per million reads mapped; ZF, zebra finch.

