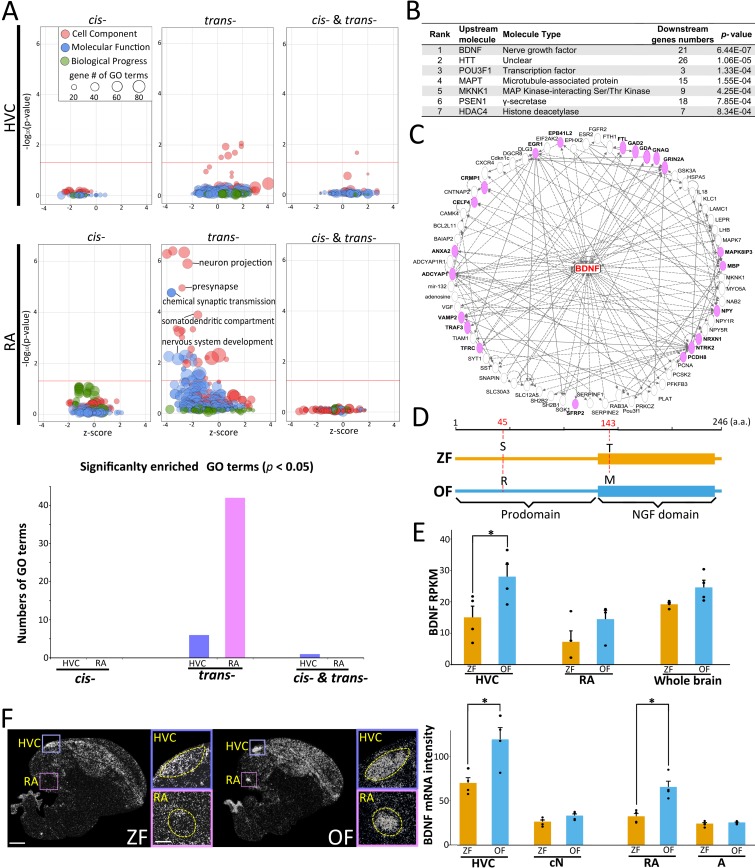
Fig 5. Predominant effect on cellular molecular function by trans-regulatory divergence.
(A) GO enrichment analysis of the cis-, trans-, and both cis- and trans-regulated genes in HVC and RA. Size of points represents the number of genes assigned to each GO term. Red lines represent the p-value for significant enrichment (Fisher’s exact test adjusted by the Benjamini-Hochberg method, p < 0.05). (B) Top 7 candidate upstream mediators for trans-regulated genes in RA. (C) Gene–gene connections for BDNF downstream genes. Pink-colored genes are trans-regulated genes in RA. Solid and dotted lines represent directed and undirected regulation, respectively, between connected genes. (D) Comparison of BDNF amino acid sequences between ZF and OF. (E) BDNF mRNA expression level in HVC, RA, and whole brain between ZF and OF at the silent condition based on RNA-seq data. (F) BDNF mRNA expression in the HVC, RA, and the surrounding areas (caudal nidopallium [cN] and archopallium [A], respectively) of ZF and OF at the 3-hour undirected singing condition (n = 4 each). White signals: BDNF mRNA. Scale bars, 1 mm (in left panes) and 200 μm (in right panel). Relevant data values are included in S4 Data. a.a., amino acid; BDNF, brain-derived neurotrophic factor; GO, Gene Ontology; NGF, nerve growth factor; OF, owl finch; RA, robust nucleus of the arcopallium; RNA-seq, RNA sequencing; RPKM, reads per kilobase of transcript per million reads mapped; ZF, zebra finch.

