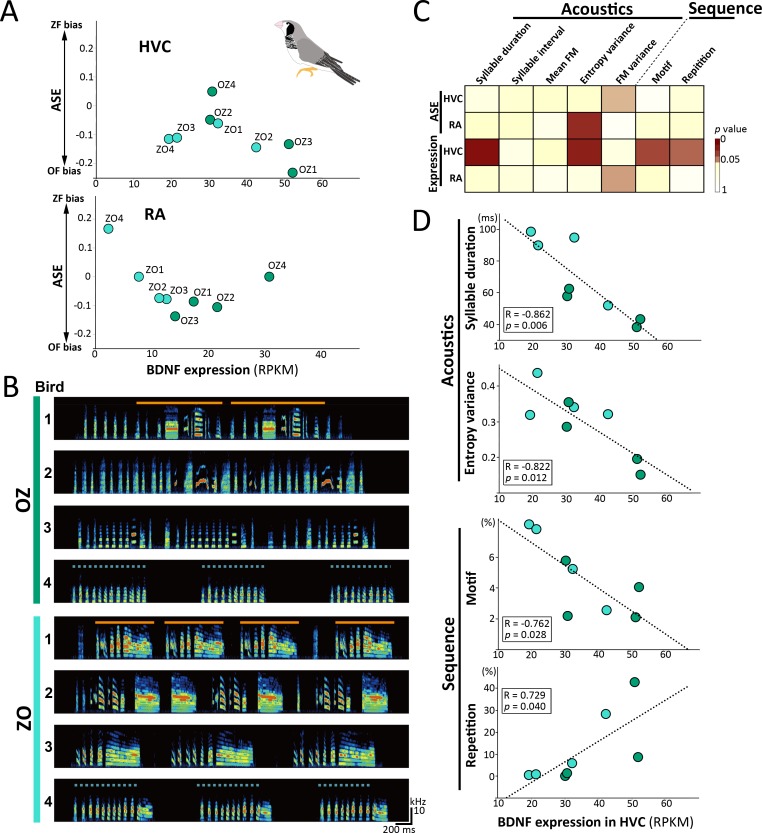
Fig 6. Correlation between individual variation in BDNF expression level and species-biased song structures in F1 hybrids.
(A) Individual variation of BDNF mRNA expression level and ASE ratio between F1 hybrids. (B) Individual variation of learned songs in F1 hybrids that were tutored with ZF and OF songs. Orange solid and blue dotted lines represent the motif and repetitive structure of syllables, respectively. (C) Heatmaps showing the correlation of p-values between the BDNF expression level or ASE ratio and species-biased song phenotypes in F1 hybrids. (D) Correlations between BDNF mRNA expression in HVC and species-biased song structures (syllable duration, entropy variance, motif, and repetition) among F1 hybrid individuals. Relevant data values are included in S5 Data. ASE, allele-specific expression; BDNF, brain-derived neurotrophic factor; F1, first-generation; OF, owl finch; OZ, F1 hybrid offspring between OF♀ and ZF♂; RA, robust nucleus of the arcopallium; RPKM, reads per kilobase of transcript per million reads mapped; ZF, zebra finch; ZO, F1 hybrid offspring between ZF♀ and OF♂.

