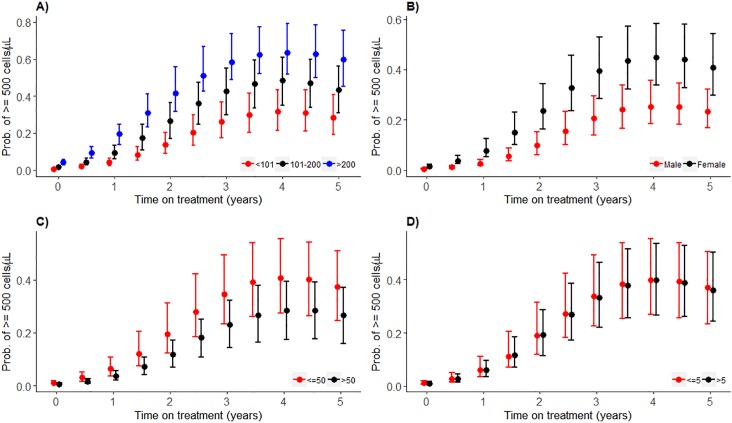
Fig 2. Predicted posterior median probability of having ≥500 cells/μL CD4 counts by covariate strata, with 95% prediction intervals.
A) baseline CD4 count (cells/μL), B) sex, C) Baseline age (years), D) baseline log10 viral load (copies/mL). Median predicted probability of having CD4 count ≥500 cells/μL from model 6. The red, black or blue dots represent predicted probability of having CD4 count ≥500 cells/μL at different time points, and the bars are the whiskers.

