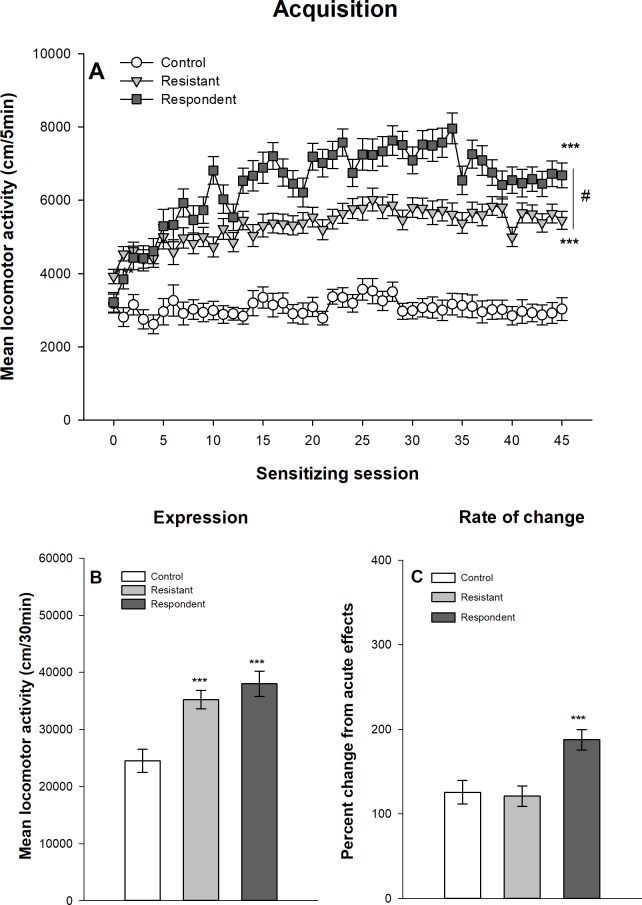
Fig 12. Acquisition and expression of behavioral sensitization following 45 ethanol administrations in female DBA/2J mice according to the D10/D1ratio procedure.
Mice sensitized to ethanol were split according to a sensitization index calculated as the ratio between the locomotor activities on the first and tenth days of sensitization according Botia et al. [10,19–21]. Sensitized mice were classified as “respondent” if their ratio exceeded the coefficient of variation in the control group. Data are expressed as mean ± SEM. (A) shows the acquisition of behavioral sensitization in mice daily injected with ethanol (respondent and resistant) or saline (control). ***p<0.0001: significantly different from the first acquisition session. #p<0.05: significant difference between resistant and respondent groups of mice on the 45th ethanol session. (B) depicts the total distance travelled during the test of sensitization following an ethanol injection for the three groups. ***p<0.0001: significantly different from the control group that was repeatedly injected with saline during the acquisition sessions. (C) represents the percentage of change in locomotor activity between the first and the last ethanol sessions (D45/D1) for each group. ***p<0.0001: significantly different from the control group that was repeatedly injected with saline during the acquisition sessions.

