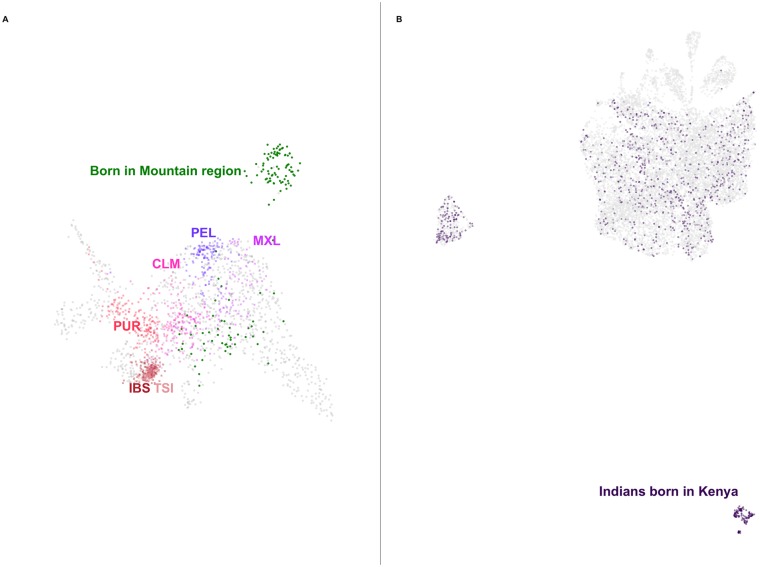
Fig 2. Applying UMAP to subsets of data can reveal deep population structure.
(A) UMAP on the top 7 principal components of the self-identified Hispanic population of the HRS reveals a cluster. Colouring the points by birthplace shows they were born almost entirely in the Mountain region (in green) of the United States (New Mexico, Arizona, Colorado, Utah, Nevada, Wyoming, Idaho, and Montana). When populations from the 1KGP are projected onto the UMAP embedding they do not map to the cluster. Six 1KGP populations are presented: CLM, Colombian in Medellin, Colombia; IBS, Iberian in Spain; MXL, Mexican in Los Angeles, California; PEL, Peruvian; PUR, Puerto Rican; TSI, Toscani in Italy. S11 and S12 Figs present the same projection of individuals from the HRS coloured by estimated admixture proportions census region of birth, respectively. (B) UMAP on the top 8 principal components of the self-identified Asian populations of the UKBB creates clusters. Indian individuals born in Kenya (in purple) form one such cluster. A version coloured by self-identified ethnicity is presented in S13 Fig.

