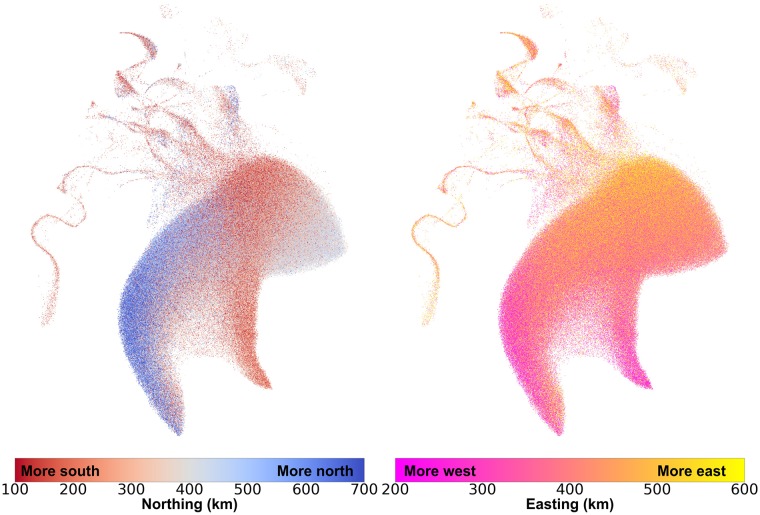
Fig 4. UMAP captures relationships between population structure and geography.
Each individual is coloured by their geographical coordinates of residence. Coordinates follow the UKBB’s OSGB1936 geographic grid system and represent distance from the Isles of Scilly, which lie southwest of Great Britain. The left image colours individuals by their north-south (“northing”) coordinates, and the right image colours them by their east-west (“easting”) coordinates. Adding more components creates finer clusters (S17 and S18 Figs). Northing values were truncated between 100km and 700km, and easting values were truncated between 200km and 600km.

