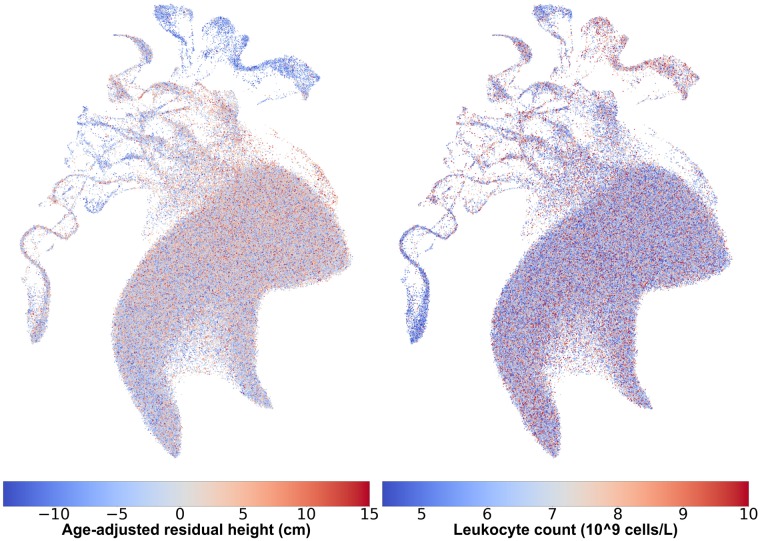
Fig 6. UMAP captures relationships between population structure and phenotype heterogeneity.
Females from the UMAP projection in Fig 3B, coloured by age-adjusted difference from mean population height (left) and leukocyte counts (right). Individuals with missing data were excluded. To protect participant privacy, data in these images has been randomized as explained in the materials and methods section.

