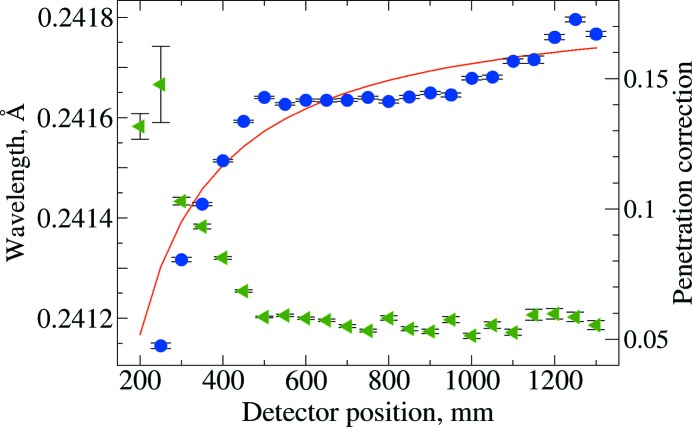
Figure 4.
Fitting results for a series of diffraction images with varying sample-to-detector distance (l i), neglecting a correction for the offset of the nominal displacement from actual, which results in varying wavelength (λ) values, shown as blue circles, scale to left. The penetration correction (see §4.1), p, is shown as green triangles, right-hand axis. Standard uncertainties are shown as error bars. At short detector distances, p and λ are highly correlated. The red line is a fit of λ = m/l i + b, goodness of fit = 14, where b yields λ extrapolated at infinite distance.

