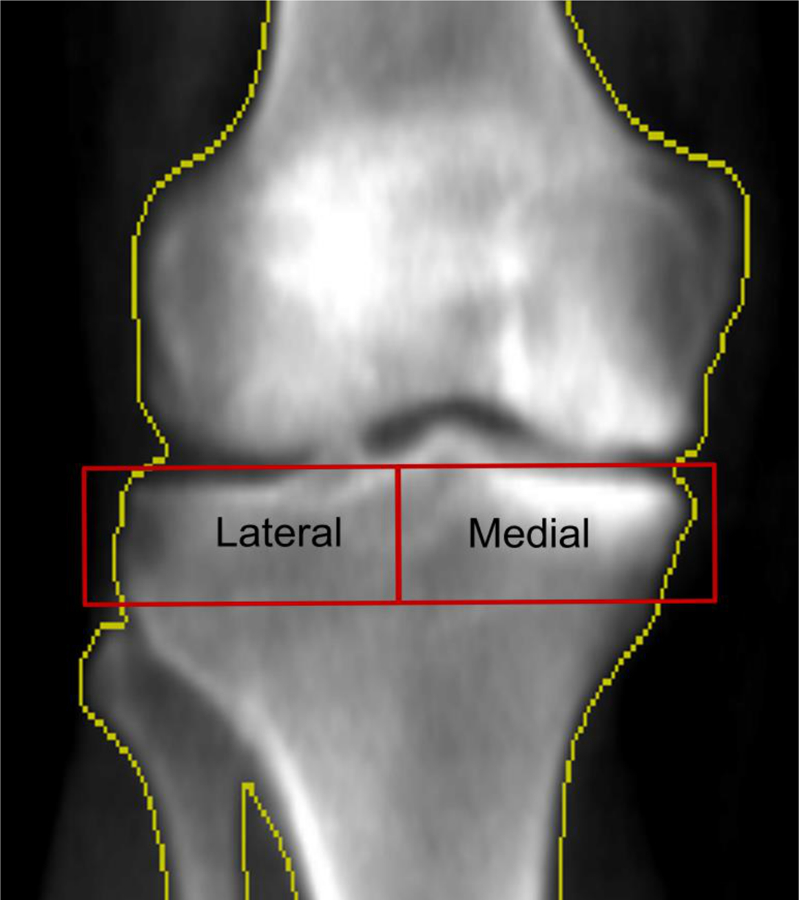
Figure 2. DXA of the same knee as in figure 2 with medial tibiofemoral osteoarthritis.

The two red rectangles bounded by the yellow bone border, labeled “Lateral” and “Medial” respectively, are the regions of interest (ROIs) used to measure the medial to lateral paBMD.
