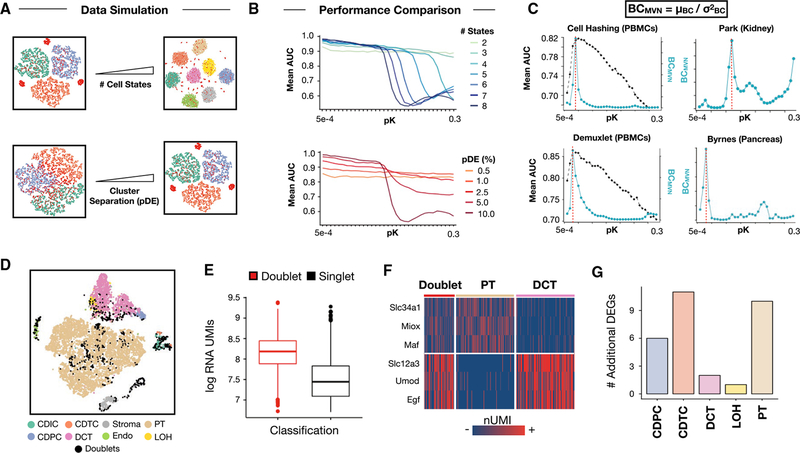
Figure 2. BCMVN Maximization Estimates Ideal DoubletFinder Parameters for Real-World scRNA-Seq Data and Facilitates DoubletFinder Application to Mouse Kidney Data with “Hybrid” Cell States.
(A) Schematic overview of data simulation strategy. scRNA-seq data including doublets (red) with different numbers of cell states (top) and extent of cluster separation in gene expression space (bottom) were simulated. pDE, probability of differential expression.(B) Simulated pN-pK parameter sweep results. Range of pK values coinciding with high mean AUC differ between simulated data with varying numbers of equally separated cell states (pDE, 10.0% for all simulations, top). DoubletFinder performance suffers on the whole when applied to simulated data with variable degrees of cluster separation (number of cell states = 8 for all simulations, bottom).(C) Comparison of BCMVN (teal) and mean AUC distributions (black) enables identification of high AUC pK values for Demuxlet and Cell Hashing data (left). BCMVN distributions for mouse kidney and pancreas data inform pK parameter selection (right). Red dotted lines denote optimal pK values based on peak BCMVN.
(D) t-SNE visualization of DoubletFinder doublet predictions (black) among mouse kidney cell types. DCT, distal convoluted tubule; PT, proximal tubule; Endo, endothelial; and LOH, loop of Henle.
(E) RNA UMI boxplots for doublets (red) and singlets (black). Data are represented as mean ± SEM.
(F) Marker gene heatmaps for doublets, PT cells (beige), and DCT cells (pink).
(G) Bar chart describing the number of additional differentially expressed genes identified following doublet removal.

