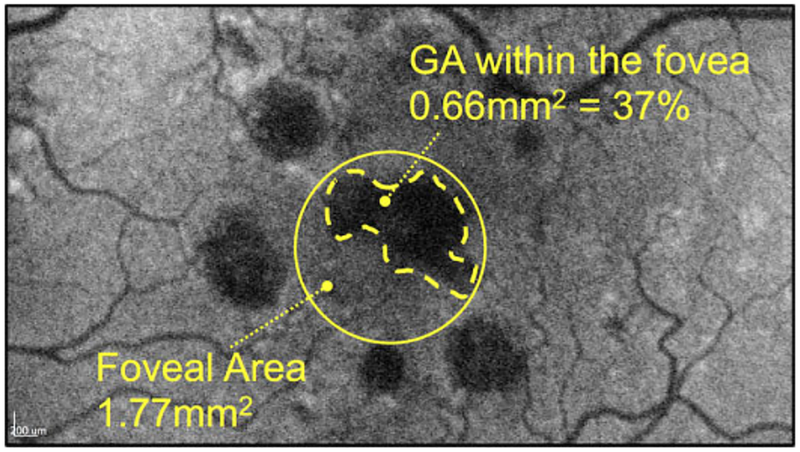
Figure 1.
Illustration of calculation of percentage of foveal geographic atrophy (GA). A 1.5-mm-diameter circle centered on the fovea centralis was determined with the use of optical coherence tomography cross-sectional and infrared images (see Methods). The outline of the GA within the foveal area was performed by 2 independent graders using the Heidelberg built-in free-hand draw tool (Heidelberg Engineering, GmbH), which automatically computes the enclosed area in square millimeters, and the percentage was calculated after division by the area defined by the standard foveal area of 1.5 mm diameter.

