. 2019 Nov 12;8:e48309. doi: 10.7554/eLife.48309

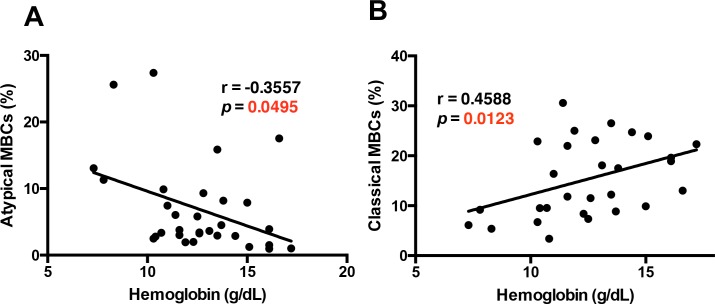
Figure 4. The atypical MBC subset correlates with the development of anemia in P. falciparum patients.

Correlation analysis of atypical (A) and classical (B) MBC subsets from the PBMC of P. falciparum patients compared with hemoglobin levels. Significance was assessed by non-parametric Spearman correlation analysis.

Figure 4—source data 1. Source data for Figure 4.
DOI: 10.7554/eLife.48309.027

Figure 4.

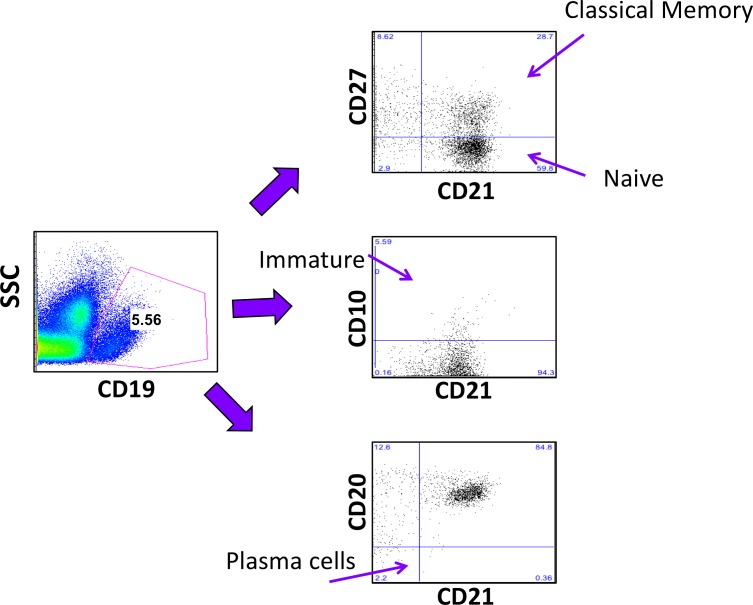
Figure 4—figure supplement 1. Gating strategy for relevant B-cell sub-populations.

Figure 4—figure supplement 1.

B-cell subpopulations of human PBMC (Weiss et al., 2009).
Figure 4—figure supplement 2. Expression of T-bet in FcRL5+ cells compared to classical MBCs.
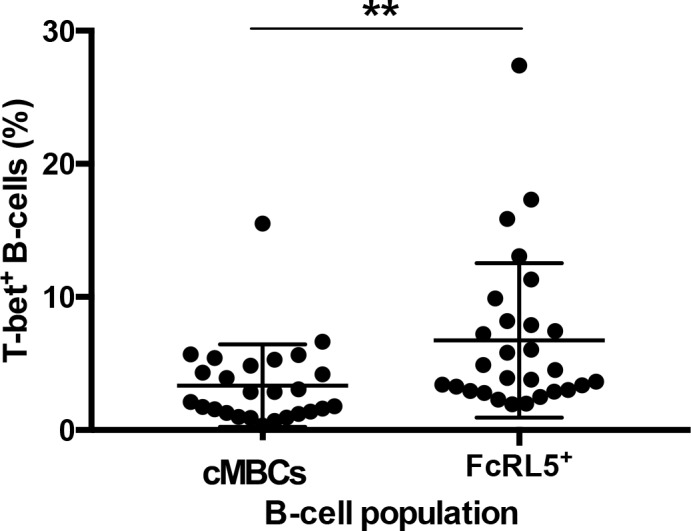
Figure 4—figure supplement 2.

Significance assessed by unpaired Student's t test. **p≤0.01.
Figure 4—figure supplement 2—source data 1. Source data for Figure 4—figure supplement 2.
DOI: 10.7554/eLife.48309.018
Figure 4—figure supplement 3. Atypical MBCs do not correlate significantly with parasitemia.
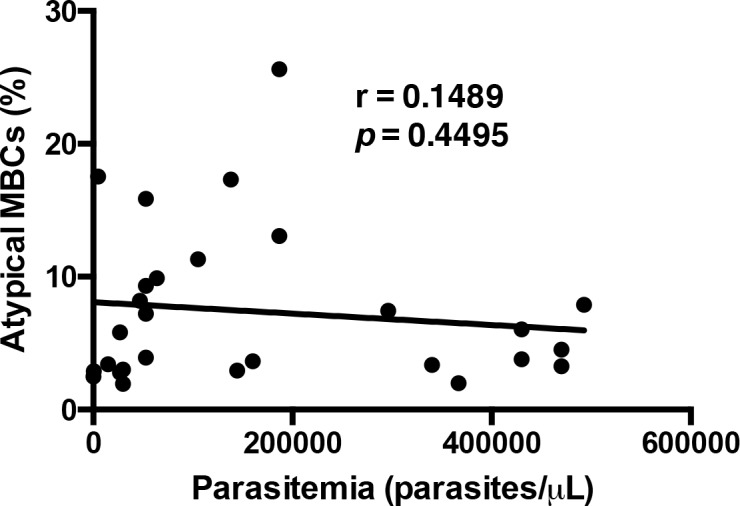
Figure 4—figure supplement 3.

Non-parametric Spearman correlation analysis comparing the percentage of atypical MBCs and parasite levels.
Figure 4—figure supplement 3—source data 1. Source data for Figure 4—figure supplement 3.
DOI: 10.7554/eLife.48309.020
Figure 4—figure supplement 4. Atypical MBCs correlate significantly with patient's age.
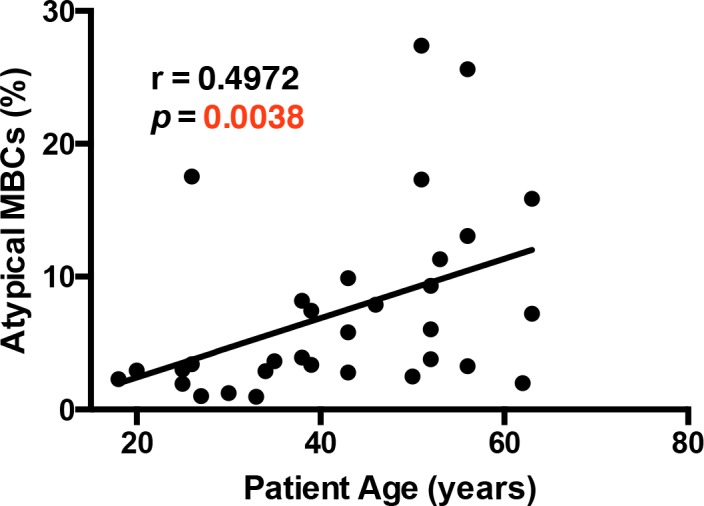
Figure 4—figure supplement 4.

Non-parametric Spearman correlation analysis comparing the percentage of atypical MBCs and patient's age.
Figure 4—figure supplement 4—source data 1. Source data for Figure 4—figure supplement 4.
DOI: 10.7554/eLife.48309.022
Figure 4—figure supplement 5. Atypical MBCs do not correlate significantly with thrombocyte levels.
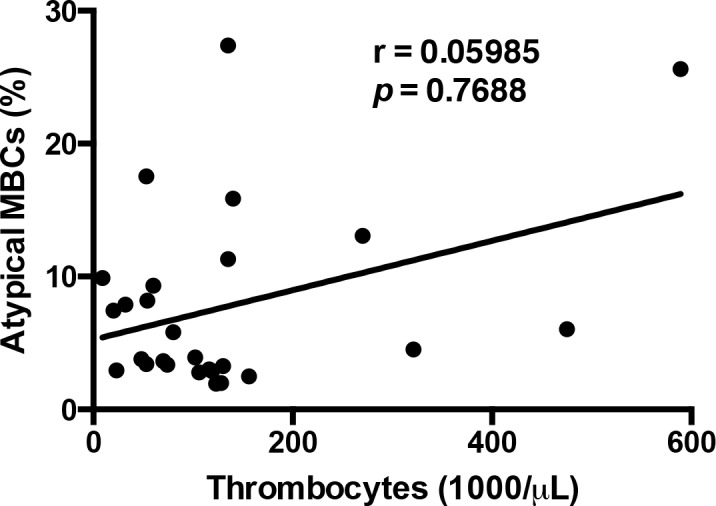
Figure 4—figure supplement 5.

Non-parametric Spearman correlation analysis comparing the percentage of atypical MBCs and thrombocyte levels in the circulation.
Figure 4—figure supplement 5—source data 1. Source data for Figure 4—figure supplement 5.
DOI: 10.7554/eLife.48309.024
Figure 4—figure supplement 6. Correlations of other B-cell subsets with hemoglobin levels in P. falciparum patients.

Figure 4—figure supplement 6.

Non-parametric Spearman correlation analysis of relevant B-cells subsets from the PBMC of P. falciparum patients: (A) naïve B-cells (CD27CD21+CD10), (B) immature B-cells (CD10+), and (C) plasma cells (CD27+CD21CD20) compared with hemoglobin levels.
Figure 4—figure supplement 6—source data 1. Source data for Figure 4—figure supplement 6.
DOI: 10.7554/eLife.48309.026