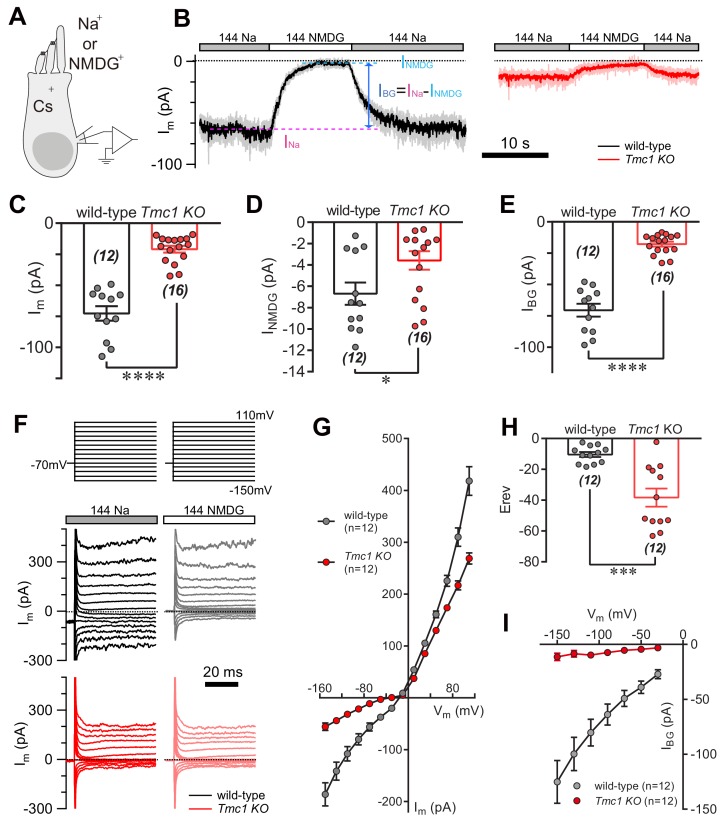
Figure 1. TMC1 mediates a background current in outer hair cells.
(A) Diagram of the recording configuration. The P6 outer hair cells (OHCs, mostly P6 apical-middle OHCs if not specified otherwise) in acutely dissociated cochlea were whole-cell voltage-clamped with Cs+ in the recording electrode and perfused with either 144 Na or 144 NMDG external solutions. 144 Na, regular recording solution; 144 NMDG, Na+ substituted with NMDG+. (B) Representative traces of membrane current (Im) in OHCs from wild-type and Tmc1-knockout (Tmc1 KO) mice. The light gray and pink traces were recorded traces that were low-pass filtered to less noisy traces shown in black and red (similar filtering applied in the following figures). IBG (background current) was calculated by subtraction of Im in 144 Na (INa) and Im in 144 NMDG (INMDG) to exclude technical leak. (C–E) Quantification of the INa (C), INMDG (D), and IBG (E) measured from recordings similar to (B). Wild-type INa, –73 ± 6 pA, Tmc1-knockout INa, –21 ± 3 pA; wild-type INMDG, –7 ± 1 pA, Tmc1-knockout INMDG, –4 ± 1 pA; wild-type IBG, –71 ± 5 pA, Tmc1-knockout IBG, –18 ± 2 pA (F). Example of Im in wild-type (black and gray) and Tmc1-knockout (red and pink) OHCs undergoing a series of membrane depolarization, with tissues bathed in 144 Na followed by 144 NMDG. (G–I) Composite data showing I-V curve (G), reversal potential (H), and IBG (I) measured and calculated from recordings similar to (F). (G) I-V curve from recordings in 144 Na. (H) Mean reversal potentials calculated from I-V curve recorded in OHCs in 144 Na. (I) IBG-V curve after subtracting INMDG. Only inward current was measured because NMDG was only applied extracellularly. The external solution contained 1.3 mM Ca2+. The holding potential was −70 mV. Data are presented as mean ± SEM. N values are shown in each panel. *p<0.05, **p<0.01, ***p<0.001, Student’s t-test.

