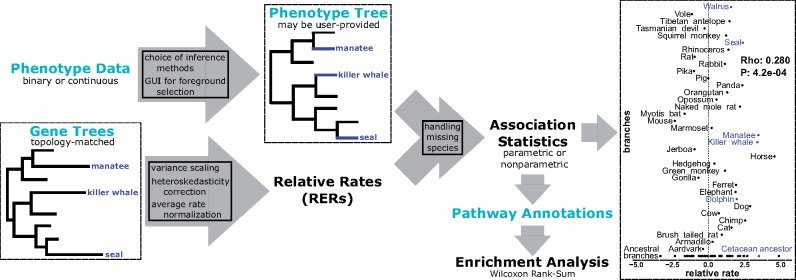
Fig. 1.
Schematic of the RERconverge pipeline focusing on the example discussed in the case study. Light blue text indicates user-provided input. Far right figure shows RER for olfactory receptor OR9Q2, a top hit for marine-specific acceleration. For additional details of the methods (boxes in arrows), see Partha et al. (2019)

