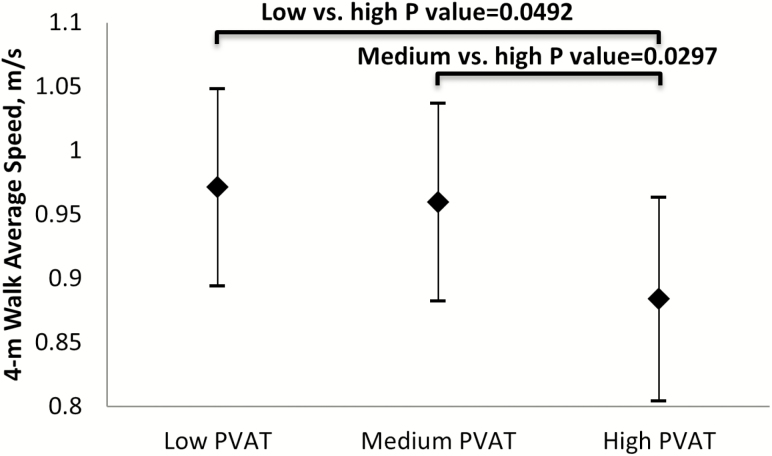
Figure 1.
Adjusted average gait speed mean by PVAT tertiles. aAdjusted for multiple testing; reference group is “high.” Model adjusted for length of the descending aorta, site, race, education, menopausal status at PVAT assessment, and the following covariates from the visit of gait speed assessment: age, BMI, smoking status, difficulty paying for basics, overall health status, and any comorbidity by gait speed assessment visit. Low PVAT: 13.163 cm3 ≤ PVAT volume< 25.949 cm3; Medium PVAT: 25.949 cm3 ≤ PVAT volume <35.625 cm3; High PVAT ≥ 35.625 cm3. BMI = Body mass index; PVAT = Perivascular adipose tissue.

